
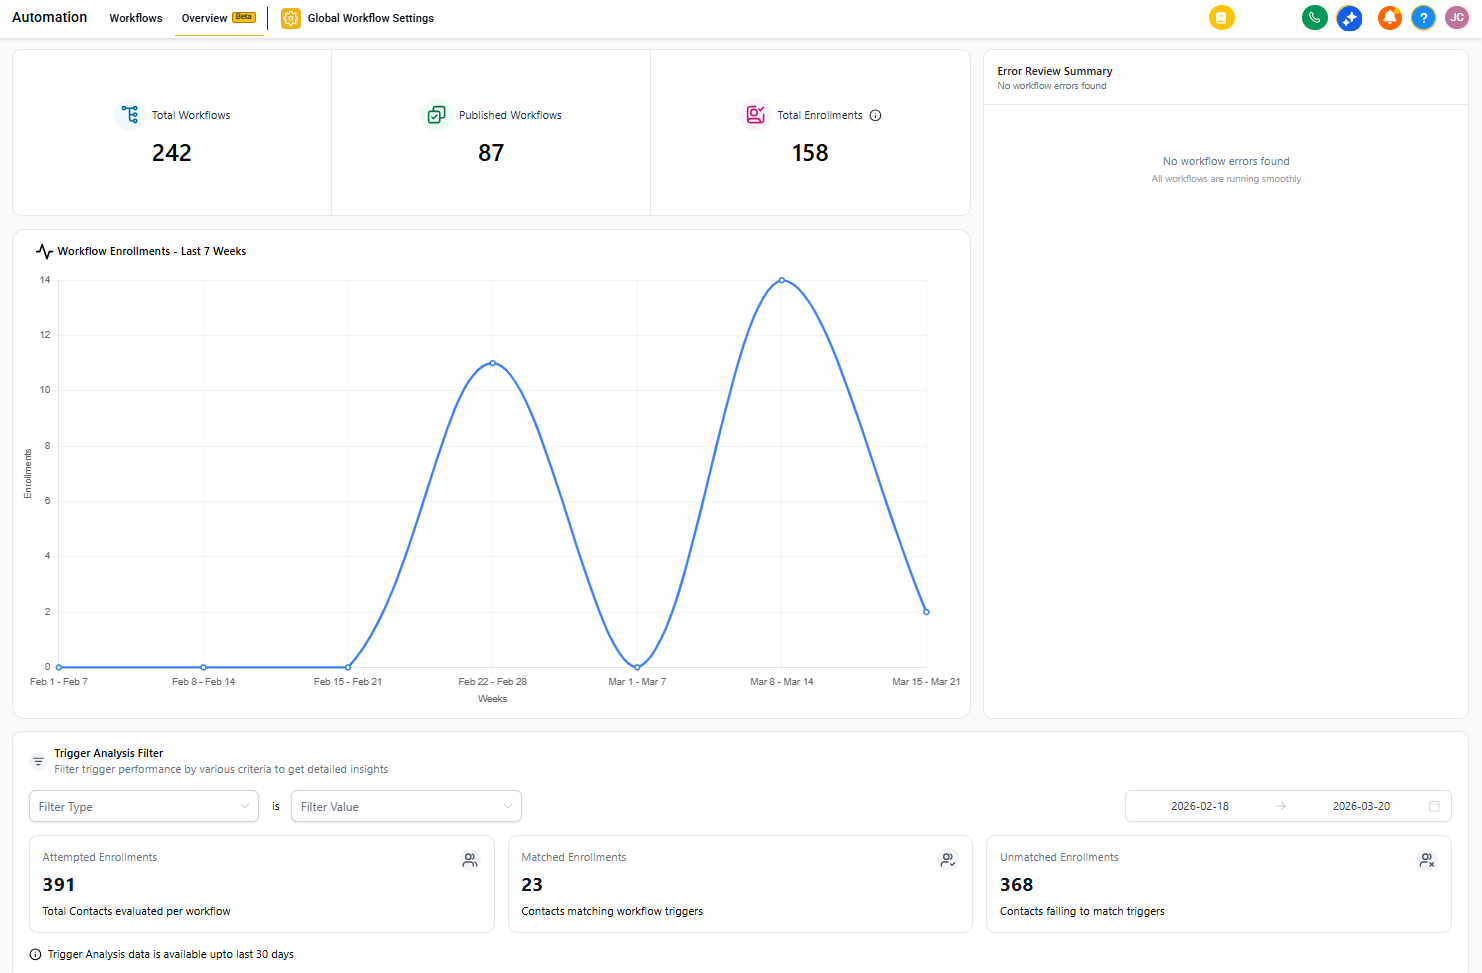
The Automation Overview Dashboard gives you a real-time view of your automation performance — all in one place. It summarizes automation counts, enrollments, and trigger insights to help you monitor and optimize your childcare center's automated processes.
What is the Automation Overview Dashboard?
This dashboard consolidates all your automation metrics into a single screen. From total automations to trigger analysis and error summaries, it helps you understand how your automations are performing without manually checking each one.
You get real-time visibility into everything: total automation enrollments, trigger-level insights, and error summaries — all in one place.
Why Use the Automation Overview Dashboard?
- Unified visibility: Track all automations, published versions, and enrollments from one page
- Trend insights: View enrollments over time to spot spikes or drops in parent activity
- Smart filtering: Filter by trigger type, automation, family, form, or survey for focused analysis
- Error tracking: Identify automations with issues instantly via the Error Review Summary
Key Components
At the top of your dashboard, you'll see a high-level summary showing total automations, published automations, and total enrollments. Below that, you'll find:
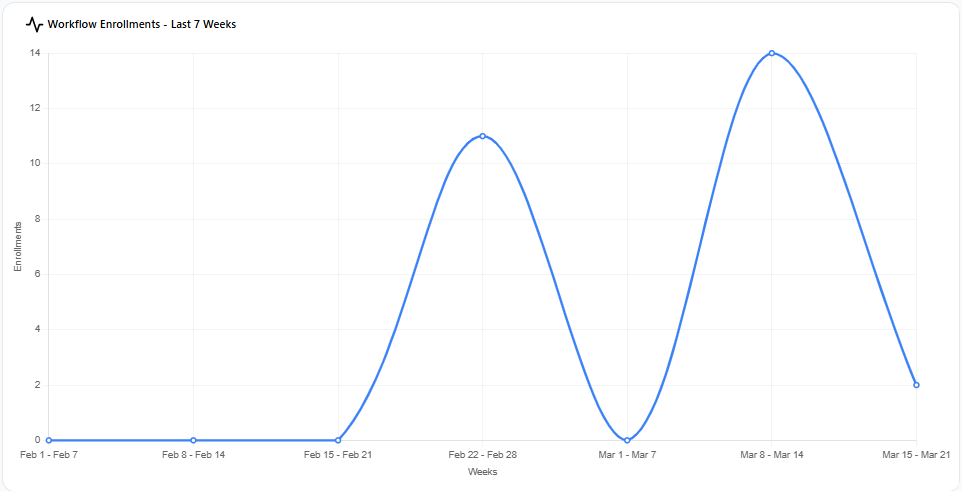
1. Automation Enrollments Over Time
Track trigger activity and enrollment trends week by week. This chart helps you see patterns in how families are moving through your automations — whether it's tour bookings, waitlist follow-ups, or enrollment reminders.
2. Trigger Analysis Filter
Filter results by trigger type, form, or survey to analyze specific automations. For example, you can see which enrollment forms are triggering the most follow-up sequences, or which tour booking automations are most active.

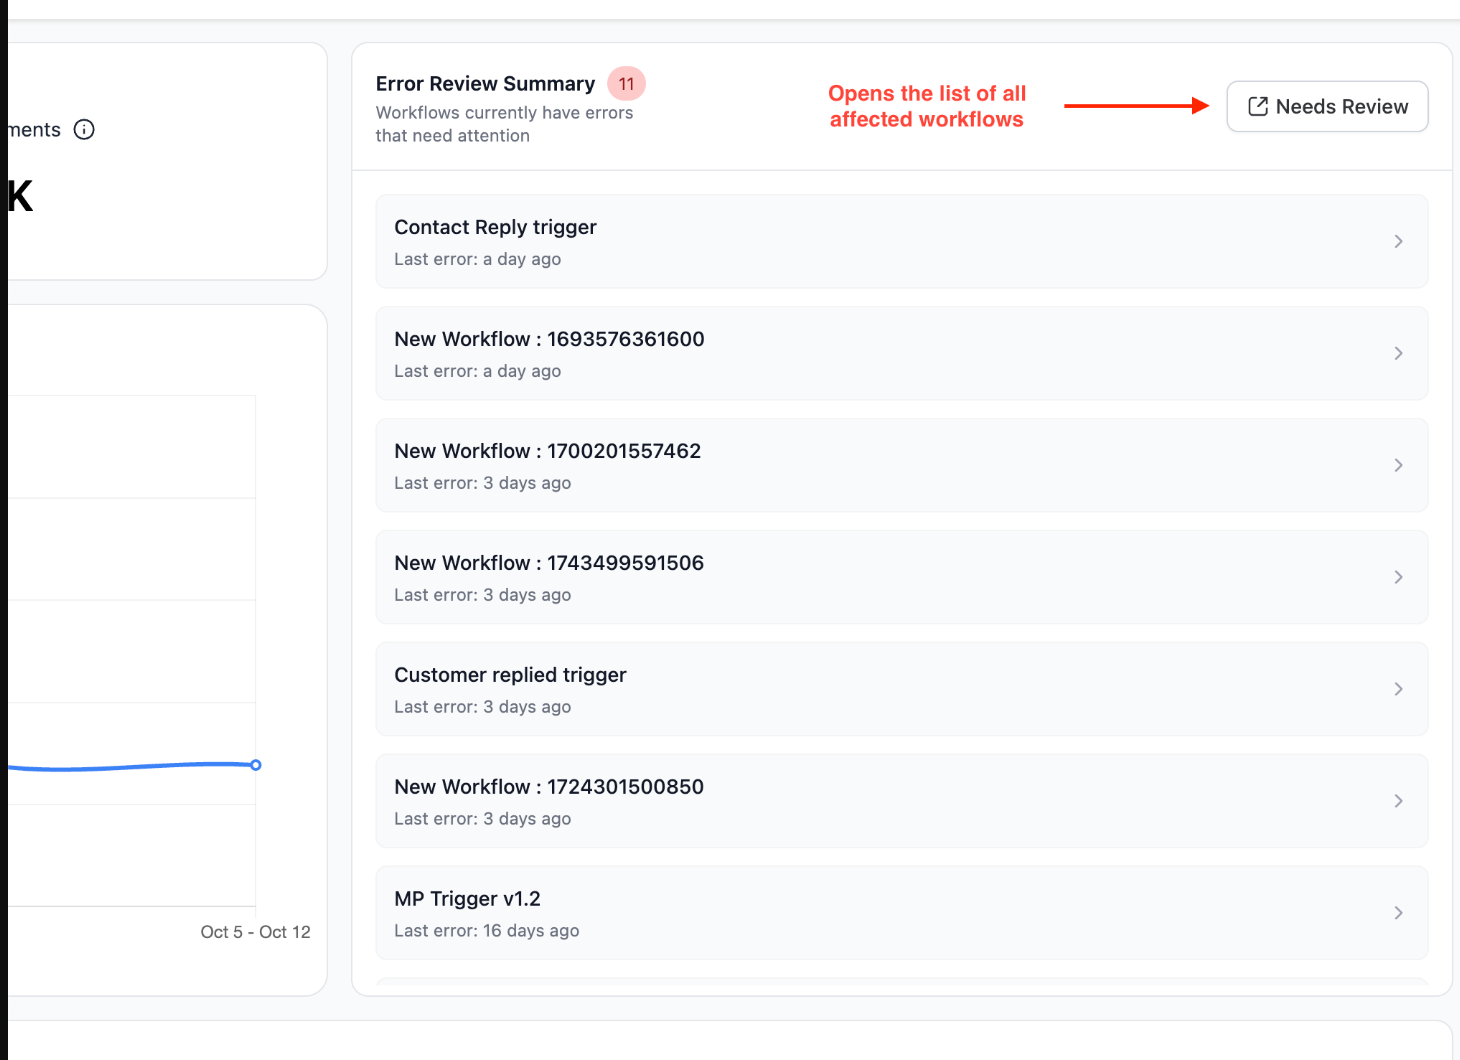
3. Error Review Summary
Instantly check if any automations encountered errors. Click "Needs Review" to view all affected automations and investigate specific issues. This section highlights all automations with potential problems so you can fix them before they impact your families.
Frequently Asked Questions
Can I filter data by a custom date range?
Yes, you can choose any date range to view enrollment trends and stats. This is helpful for reviewing specific time periods like your busy enrollment season or after launching a new automation.
What timezone does the data reflect?
All data aligns with your account's timezone setting. You can verify this in your Settings.
Where can I find automations with errors?
They appear under the Error Review Summary section at the bottom of your dashboard. Click "Needs Review" for detailed insights into each affected automation.
Where can I see high-level performance across all automations?
Use the Automation Overview Dashboard (Automations → Overview) for enrollments, match vs. unmatch data, and error reviews. Then drill down to a specific automation's Trigger Stats for detailed performance metrics.