
What is Click Performance in Email Statistics?
Click Performance shows you exactly how parents and families interact with the links in your email campaigns. It tracks which links get clicked, how often, and by whom — helping you understand what resonates with your audience.
Use these insights to see which calls-to-action work best, whether it's "Schedule a Tour," "Complete Your Enrollment," or "View Our Programs."
Note: Click tracking only works for emails you've already sent. Draft or scheduled emails won't show any statistics until they're delivered.
Why Track Click Performance?
Understanding click behavior helps you:
- See which links and buttons get the most engagement
- Identify what parents care about most in your communications
- Track how well your calls-to-action perform over time
- Measure click-to-open ratios to evaluate content effectiveness
- Make data-driven improvements to future email designs and placements
Enabling Click Tracking
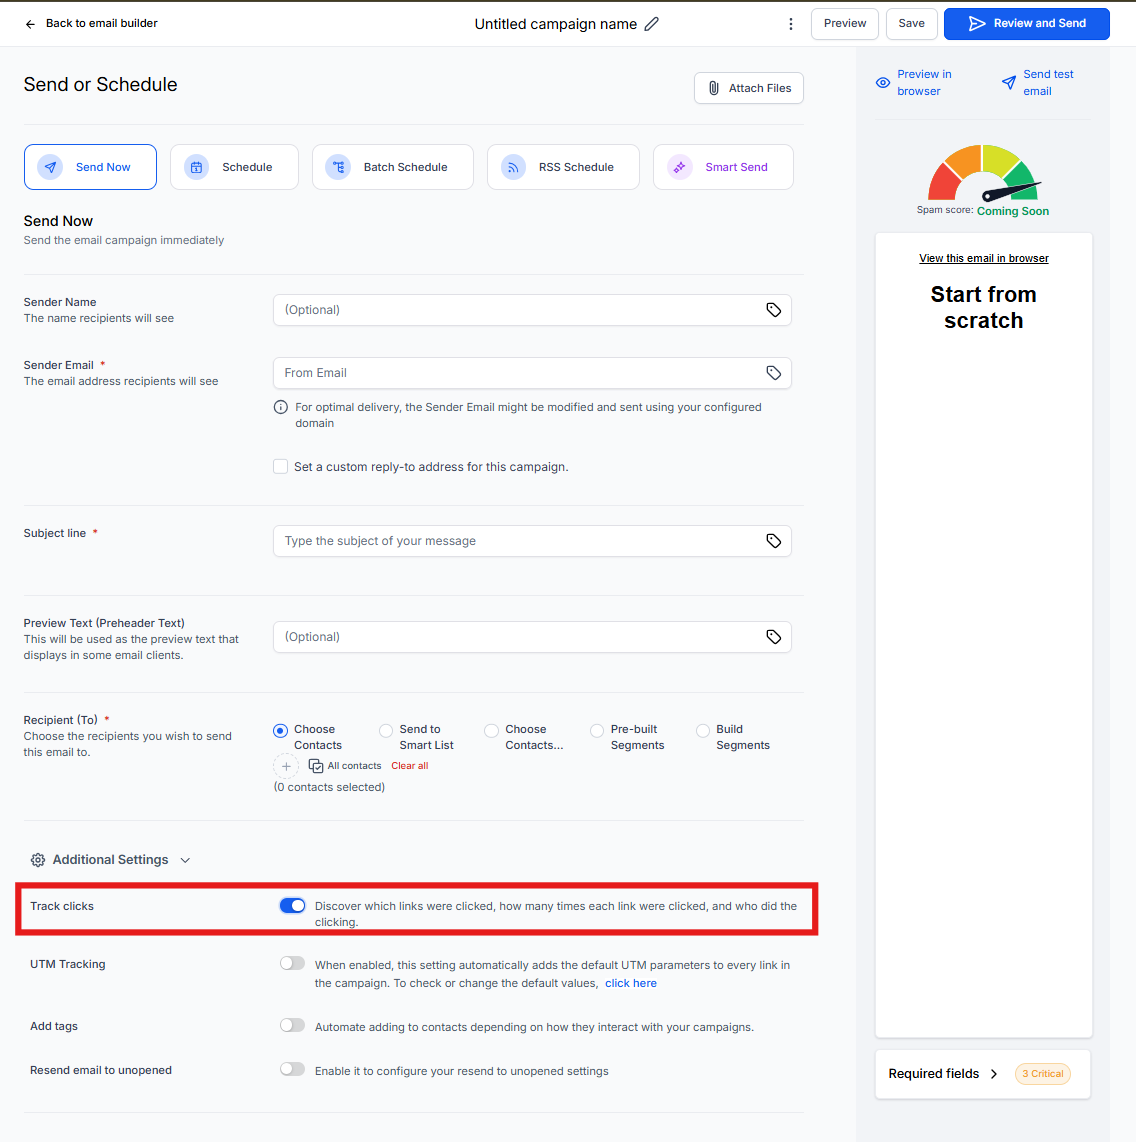
Before Enrollio can track clicks, you need to turn on click tracking when setting up your campaign.
Here's how:
- Go to Marketing → Emails → Campaigns
- Choose your campaign or create a new one
- On the Send and Schedule page, scroll to Additional Settings
- Toggle ON Track Clicks
- Complete your setup and send the campaign
Once your email is delivered, click activity will appear under the Click Performance tab in your campaign statistics.
Optional: Enable UTM Tracking to automatically tag all links with campaign data for your analytics tools.
When to Use Click Performance Reports
Click Performance is your go-to resource when you need to measure real engagement, not just email opens.
Use it to:
- Analyze call-to-action effectiveness — See which "Schedule a Tour" or "Apply Now" buttons drive the most clicks
- Evaluate promotional success — Track engagement on open house invitations or enrollment discounts
- Understand parent preferences — Learn which program information or resources get the most attention
- Compare campaign performance — Measure differences between your monthly newsletter and special announcements
- Improve future emails — Adjust layout, messaging, and button placement based on what works
Accessing Click Performance Data
To view click results after sending a campaign:
- Navigate to Marketing → Emails from your dashboard
- Go to the Campaigns tab
- Find your sent email campaign
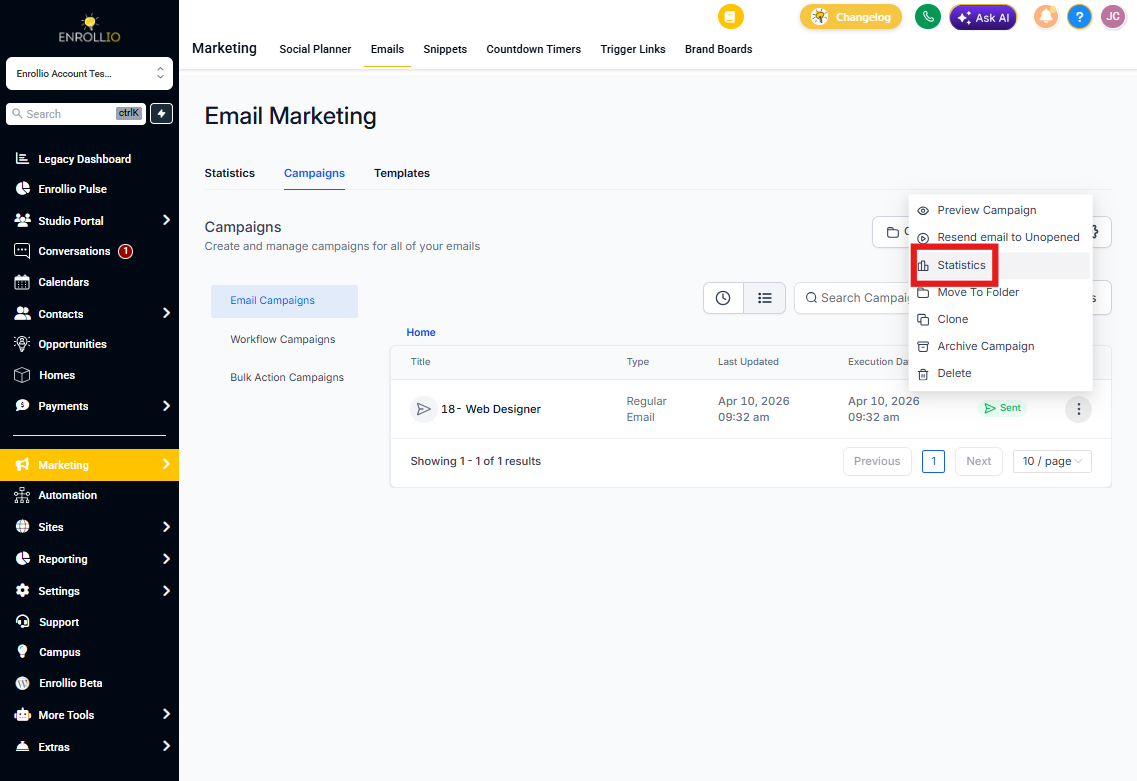
- Click the three-dot menu (⋮) next to the campaign name
- Select Statistics
- In the stats panel, click Load More Statistics
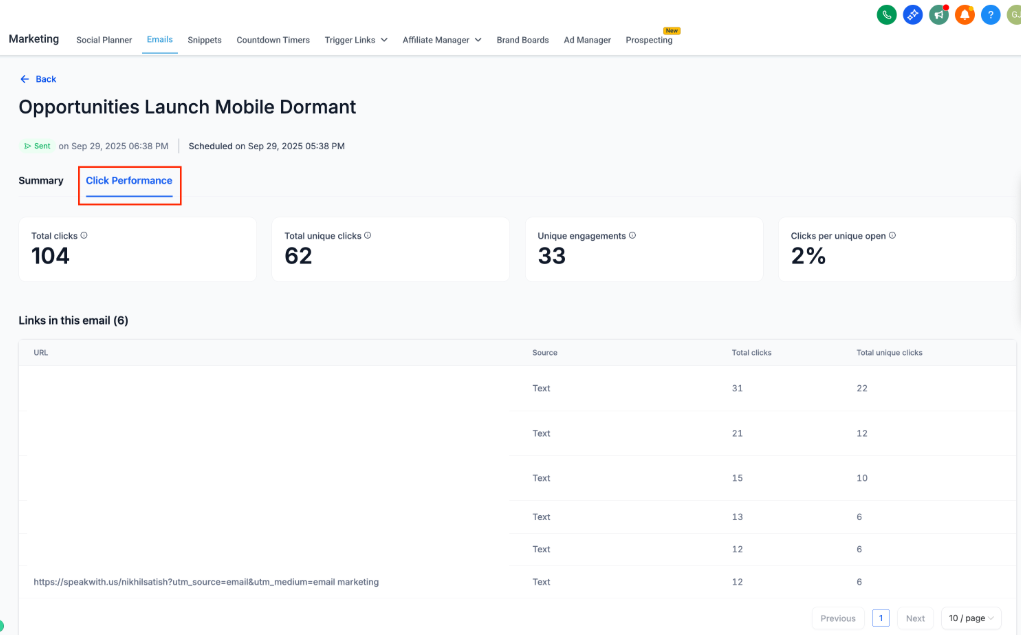
- Select the Click Performance tab at the top
- Review the data in the Summary and Links sections
Understanding Click Metrics
Click Performance includes several key metrics that tell you how parents and families engage with your emails:
Total Clicks
The total number of times all links in your email were clicked — including multiple clicks from the same person. If a parent clicks your tour scheduling link three times, that counts as three total clicks.
Total Unique Clicks
The number of individual people who clicked at least one link in your email. Each person is counted only once, no matter how many times they clicked.
Unique Engagements
The total number of recipients who interacted with at least one link in your email. This is essentially the same as Total Unique Clicks.
Clicks per Unique Open
This percentage shows how many people who opened your email actually clicked a link. It's a key indicator of how engaging your content and calls-to-action are.
Example: If 100 parents opened your email and 25 clicked a link, your clicks per unique open is 25%.
Links in This Email
This table shows every link in your email with detailed performance data:
- URL — The link destination
- Source — Where the link was placed (text, button, or image)
- Total Clicks — How many times the link was clicked overall
- Total Unique Clicks — How many different people clicked that link
Frequently Asked Questions
Why don't I see Click Performance data for my campaign?
Make sure Track Clicks was turned on under Additional Settings before sending the email. Without it, Enrollio can't track clicks.
How soon after sending will I see click data?
Click data appears as soon as parents and families start engaging with your email. Results update in real-time as recipients interact with your links.
Can I track clicks on image links?
Yes. The Click Performance report tracks all clickable elements in your email — text links, buttons, and linked images.
What's a good click-to-open rate for childcare emails?
While it varies by campaign type, a 15-25% click-to-open rate is generally considered strong. Tour invitations and enrollment deadlines often see higher rates, while newsletters may be lower.