
Enrollment Page Statistics
Track how your enrollment pages are performing with built-in statistics. You'll see exactly how many families are viewing your pages, filling out forms, and completing enrollments — all in one place.
How to Access Your Stats
Step 1: Navigate to Your Enrollment Page
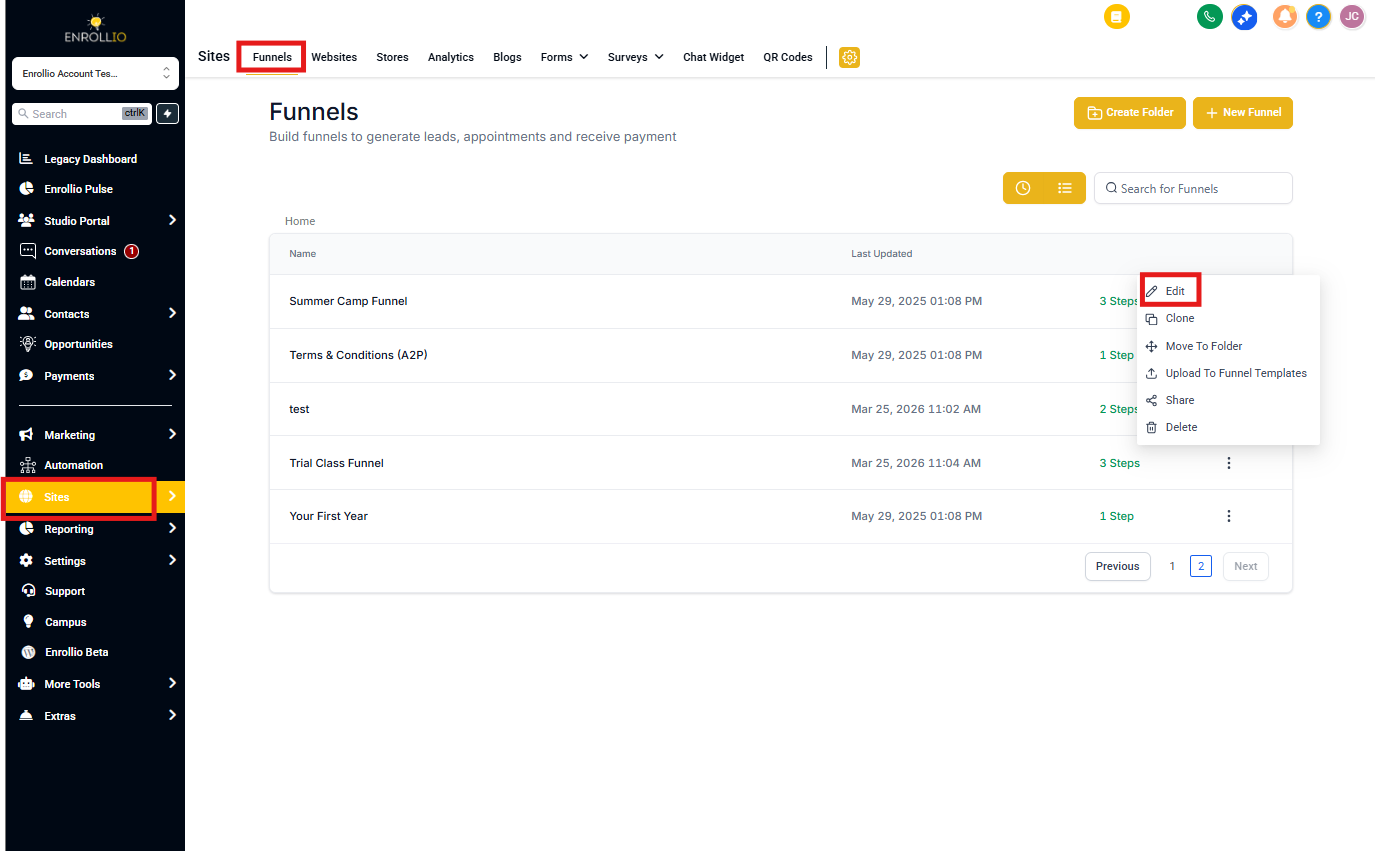
- From the left navigation menu, click Sites
- In the top ribbon, select Enrollment Pages or Sites
- Click the three dots next to the page you want to analyze
- Select Edit
Step 2: Open the Stats Tab
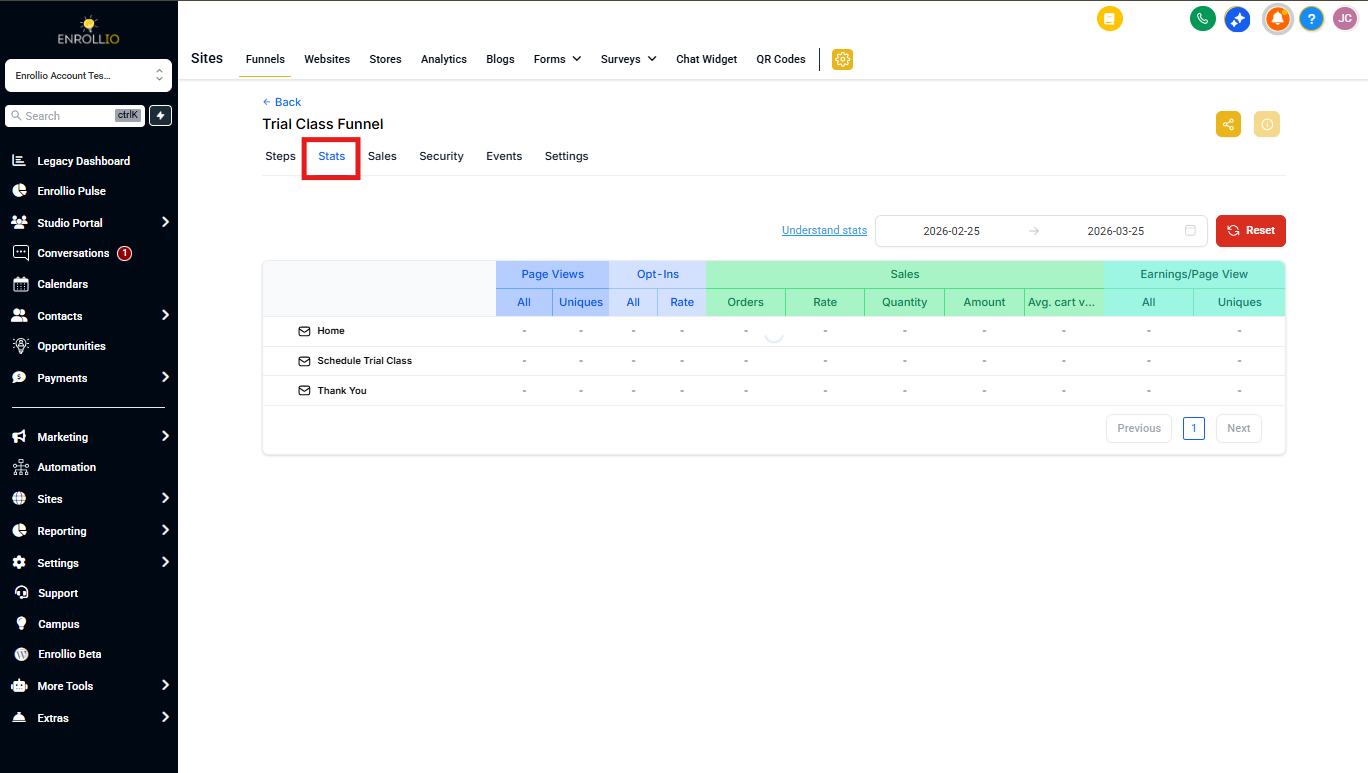
- In the top navigation bar inside your page editor, click the Stats tab
- Use the date filter in the upper-right to view specific time periods
Step 3: Review Your Performance
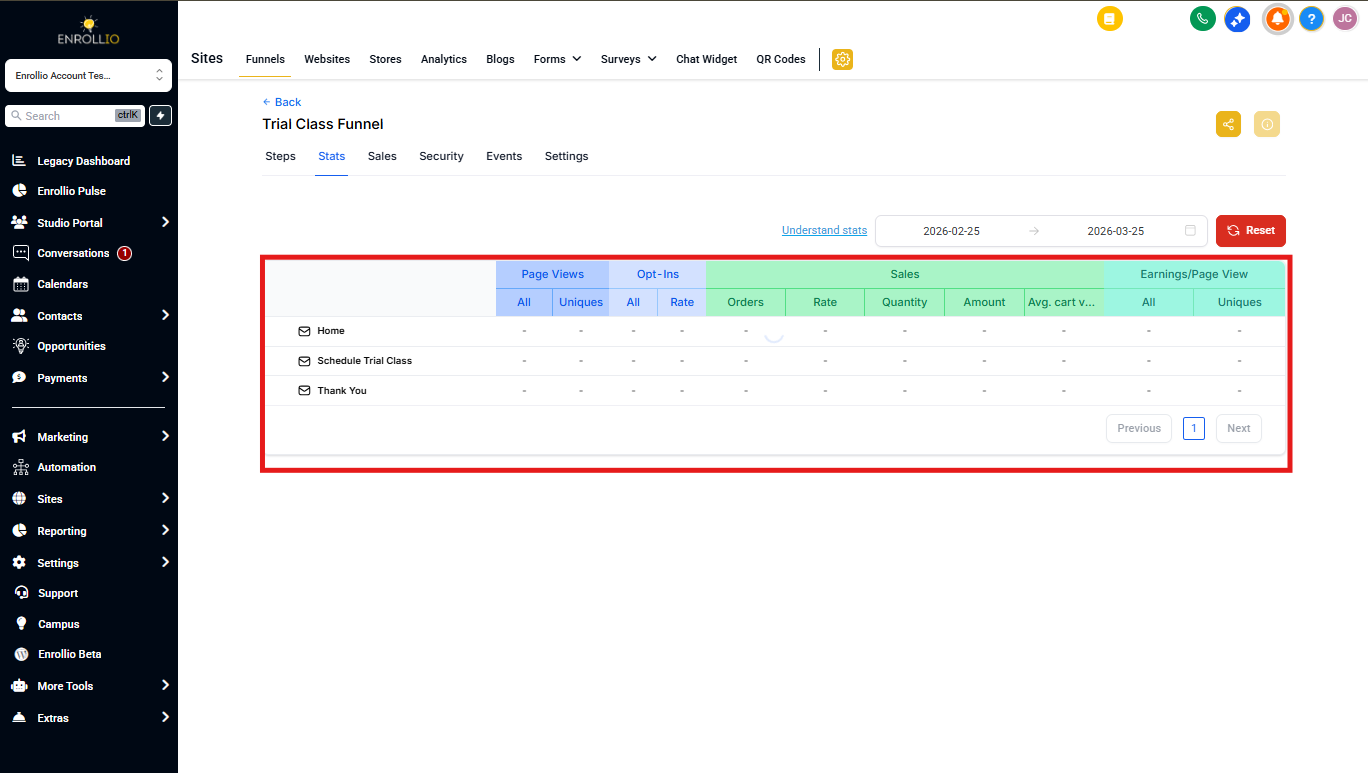
Your stats table shows performance for each step of your enrollment page:
- Page: The specific page or step name
- Views (All/Unique): Total visits and individual visitors
- Opt-ins (Count/Rate): Form submissions and conversion rate
- Sales (Count/Rate/Value): Completed enrollments, conversion rate, and total revenue
- Earnings/Page View: Revenue generated per page visit
Understanding Your Metrics
Page Views
- All: Total number of times the page was loaded (includes repeat visitors)
- Unique: Number of individual families who viewed the page
Opt-ins
These track when families submit forms on your enrollment pages — whether it's an inquiry form, tour request, or application.
- Count: Total number of form submissions
- Rate: Percentage of unique visitors who submitted a form (Opt-ins × 100 ÷ Unique Views)
Sales
Sales track completed enrollments or payments made through your enrollment pages.
- Count: Number of enrollments or products purchased
- Rate: Percentage of unique visitors who completed an enrollment (Sales × 100 ÷ Unique Views)
- Value: Total revenue generated
Earnings per Page View
This shows how much revenue each page visit generates on average: Total Revenue ÷ Total Page Views
Use this metric to identify your highest-performing enrollment pages and understand which pages drive the most value for your center.
Site and Page Analytics Dashboard
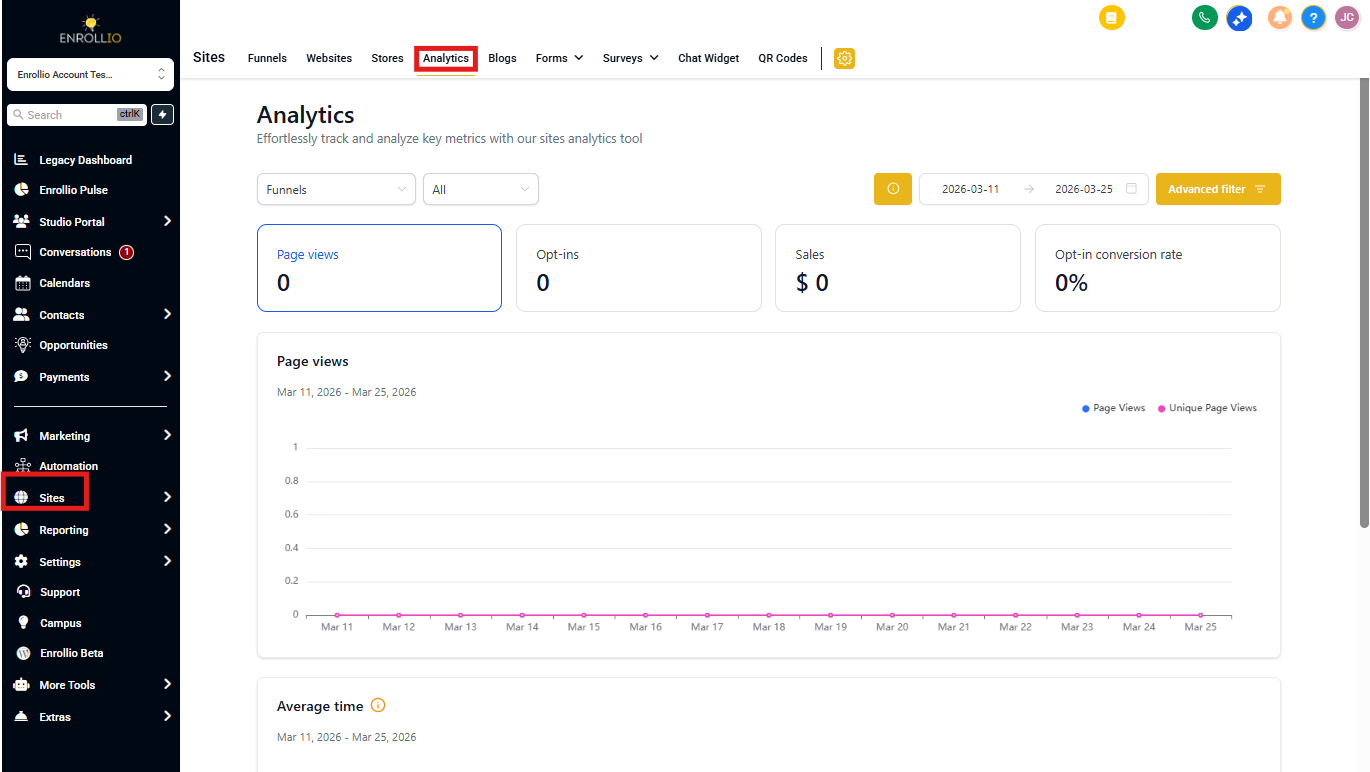
The Stats tab shows page-level performance. For a bigger picture view across all your enrollment pages and sites, use the Analytics dashboard.
The Analytics dashboard includes:
- Visual graphs and charts
- Visitor trends over time
- Traffic source breakdowns
- Comparison tools across multiple pages
To access it, go to Sites > Analytics.
Frequently Asked Questions
Why don't my stats match Google Analytics?
Enrollio and Google Analytics count visits differently. Differences can come from ad blockers, how bounce rates are filtered, or visitors who land on pages outside your enrollment flow. Both tools are accurate — they just measure things slightly differently.
Can I trigger automations based on page views?
Yes! You can automatically send follow-up texts or emails when a family views a specific enrollment page. This is perfect for sending tour reminders or answering common questions right when families are most interested.
What counts as an opt-in?
Any time a family successfully submits a form on your enrollment page — whether it's an inquiry form, tour request, or application — it counts as an opt-in.