
This guide explains each metric you'll see when reviewing your enrollment page and website performance. Use these definitions to understand what's working and where you can improve your family engagement.
Page Views
Tracks how many times parents visit your enrollment pages.
| Type | Description |
|---|---|
| All | All page views — includes when the same person visits multiple times |
| Unique | Individual visitors who viewed the page |
Example: One parent visits your tour request page twice → All = 2, Unique = 1
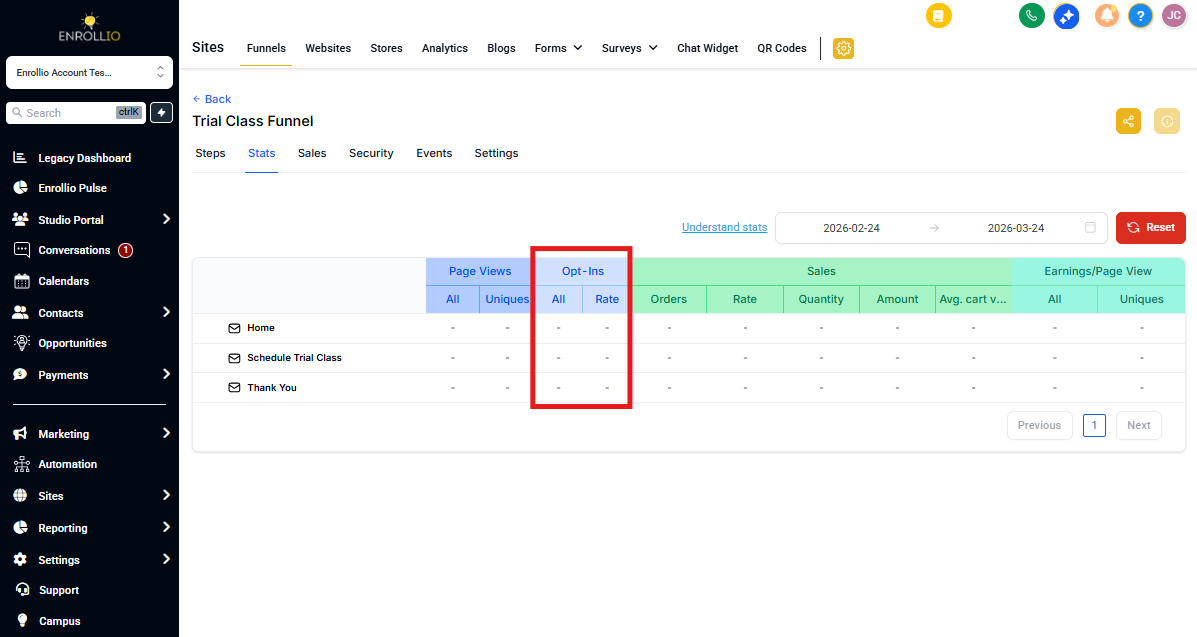
Opt-Ins
Measures how many families expressed interest in your childcare center.
| Type | Description |
|---|---|
| All | Total families who requested information, submitted a form, booked a tour, or completed enrollment |
| Rate | All opt-ins divided by unique page views |
Example: 50 tour requests from 200 unique visitors → Rate = 25%
Sales - Orders
Counts enrollment payments and registration fees processed through your pages.
| Level | Description |
|---|---|
| Page Level | Total number of orders placed (doesn't count quantities or individual items) |
| Individual Product Level | Number of times a specific enrollment package or fee was purchased |
| Bump Product | Number of times an add-on (like extended care or meals) was purchased |
Example: 30 families enrolled in a page, 18 chose the full-time package, and 5 added extended care → Page Level = 30, Individual Product Level = 18, Bump Product = 5
Sales - Rate
Shows your conversion from visitors to paying families.
| Level | Description |
|---|---|
| Page Level | Total orders divided by unique page views |
| Individual Product Level | Times a specific package was purchased divided by unique page views |
| Bump Product | Times an add-on was purchased divided by total orders on that page |
Example: 20 families added extended care out of 100 total enrollments → Bump Rate = 20%
Sales - Quantity
Total items or packages sold.
| Level | Description |
|---|---|
| Page Level | Total quantity of all products purchased through this page |
| Product Level | Total quantity of a specific enrollment package or add-on |
Example: 10 orders with 3 items each (registration + tuition + supplies) → Quantity = 30
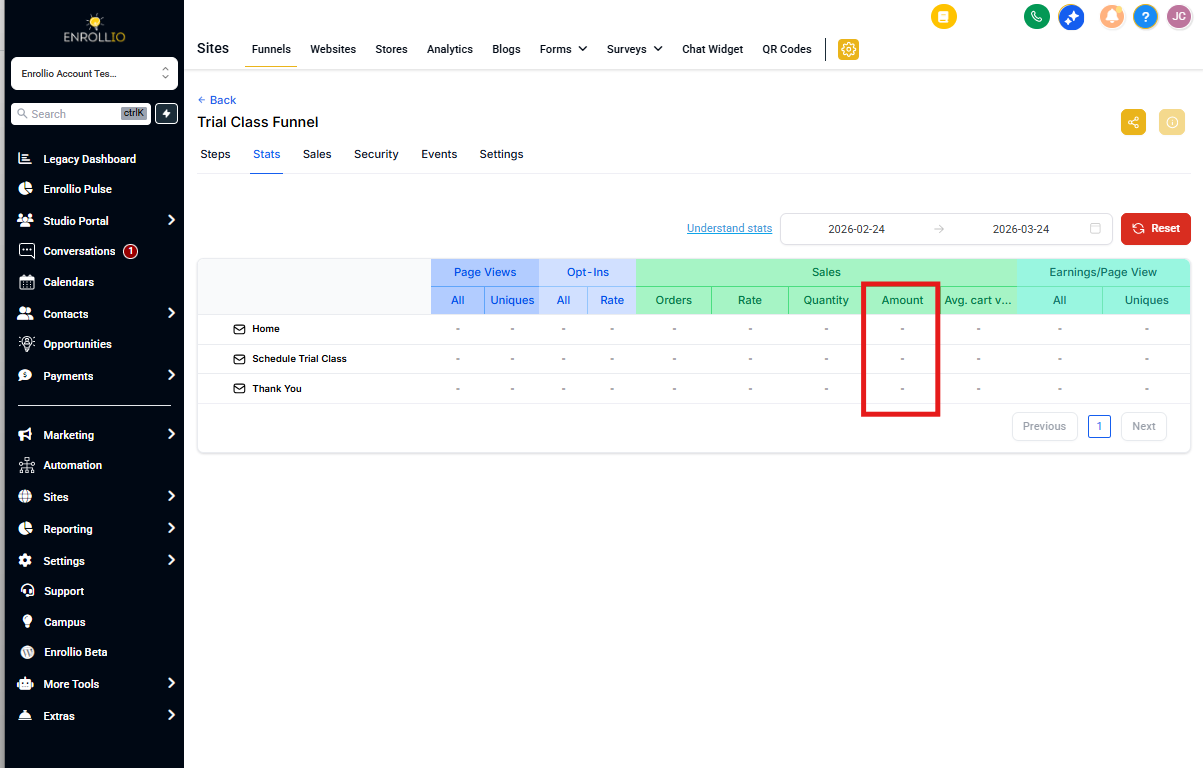
Sales - Amount
Total revenue generated from your enrollment pages.
| Level | Description |
|---|---|
| Page Level | Total value of all payments collected through this page |
| Product Level | Total revenue from a specific enrollment package or fee |
Average Cart Value
Average revenue per enrollment.
| Level | Description |
|---|---|
| Page Level | Total sales amount divided by total orders |
| Product Level | Not applicable |
Example: $10,000 in enrollment fees from 20 families → Average Cart Value = $500
Pro Tip: Track your average cart value over time. If it's declining, consider highlighting add-ons like extended care, meals, or activity programs during enrollment.
Earnings Per Page View
Revenue generated per visit to your enrollment pages.
| Type | Description |
|---|---|
| All | Total sales value divided by all page views (including repeat visits) |
| Uniques | Total sales value divided by unique page views |
Example: $5,000 in enrollment revenue from 5,000 page views → $1 earnings per view
Performance Indicators
Use these benchmarks to gauge your enrollment page performance.
What to Aim For
- Growing number of unique visitors and opt-ins
- Steady or improving conversion rates
- Strong average enrollment value
- Healthy revenue per page view
Warning Signs
- Declining or consistently low unique visitor traffic
- Low opt-in or enrollment conversion rates
- Small average order values
- Poor uptake of add-ons or extended programs
Pro Tip: Review your stats weekly during enrollment season. Small improvements to your opt-in rate can have a big impact on how many families you convert to enrolled students.