
What’s New
We’ve introduced Blog Statistics inside Analytics, giving you one place to track how your blogs and posts are performing. You can now see views, clicks, and engagement data across all your content without needing separate tools.
Note: Data collection began on August 28, 2024. Any data before this date will display as “Unknown.”
Key Benefits of Blog Analytics
At a Glance – Quickly check overall blog performance with high-level metrics.
Repeat What Works – Identify top-performing posts and replicate their success.
Know Your Readers – Understand behavior through device and category insights.
Check Engagement – Monitor link-click activity to measure interest.
Compare Content Sources – See performance differences between imported posts and manually created posts.
How to Access Blog Statistics
Log in to your sub-account.
Go to the Sites tab.
Click the Analytics tab.
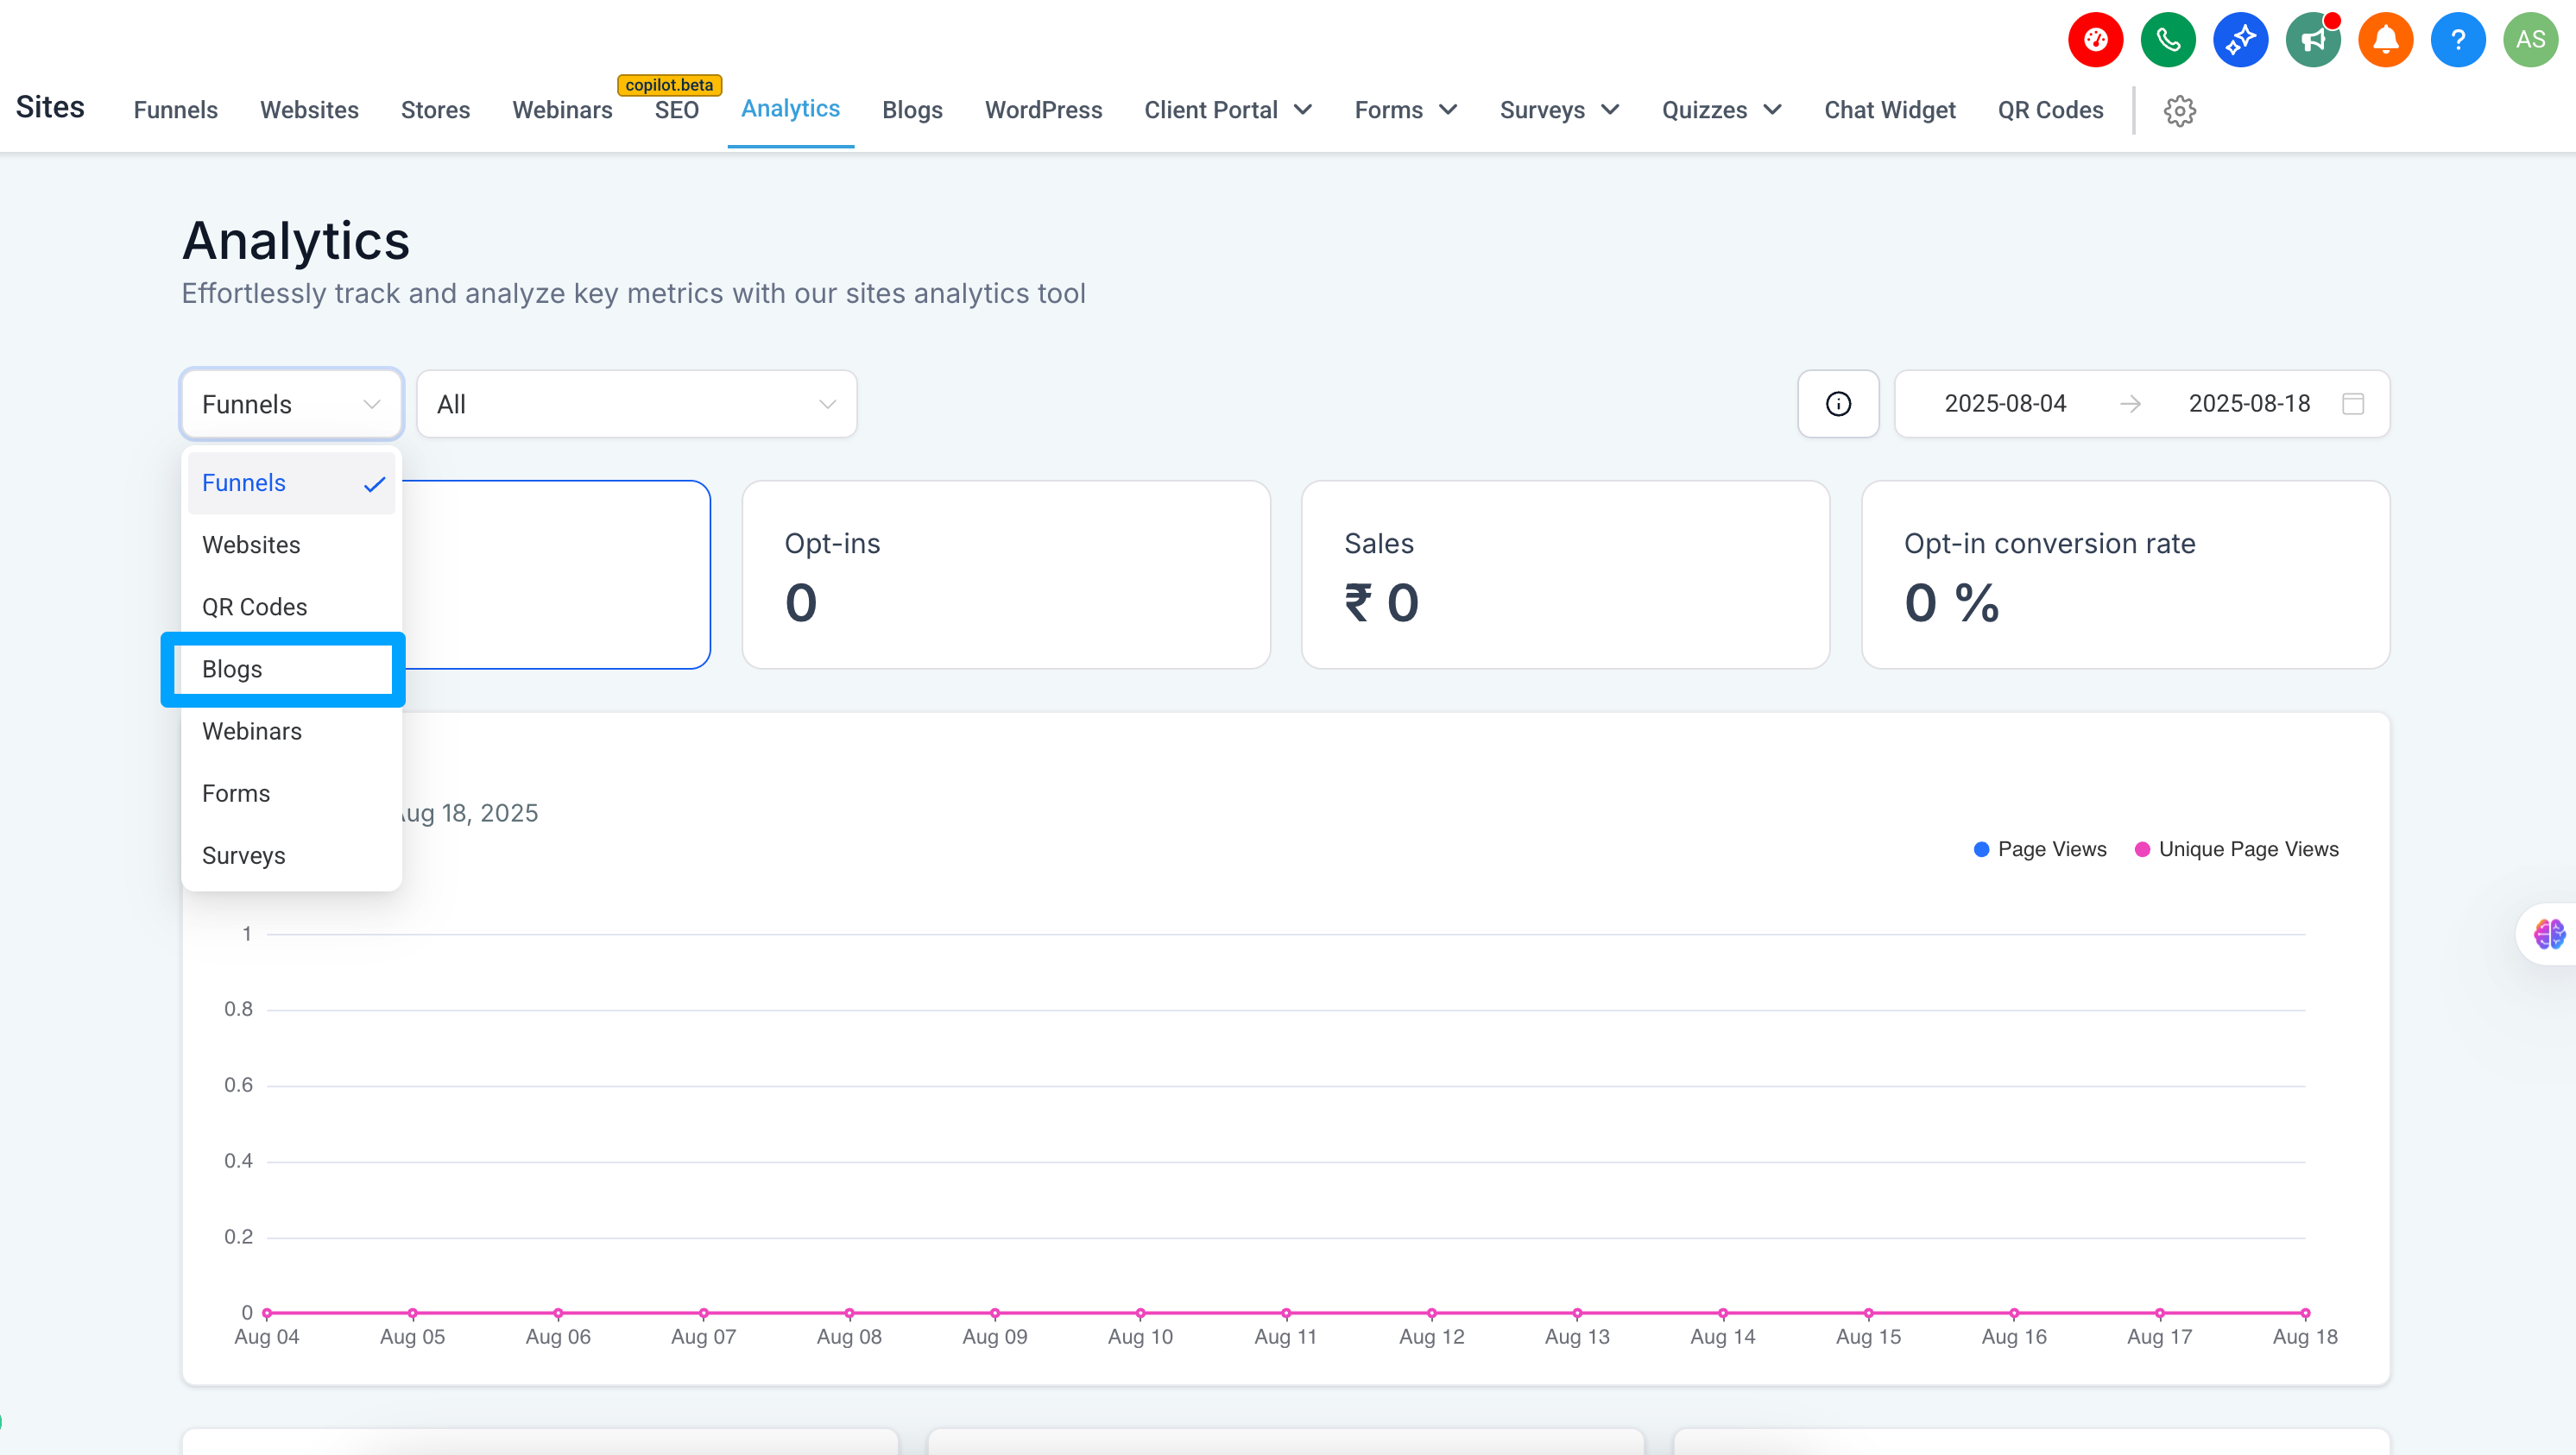
Use the category selector drop-down and select Blogs.
Allow the dashboard to load—your performance metrics will display.
Use the date range and blog site selector to refine your data view.
Analytics Sections
Quick Performance Overview
Total page views
Number of published blog sites
Total published posts
Trends Over Time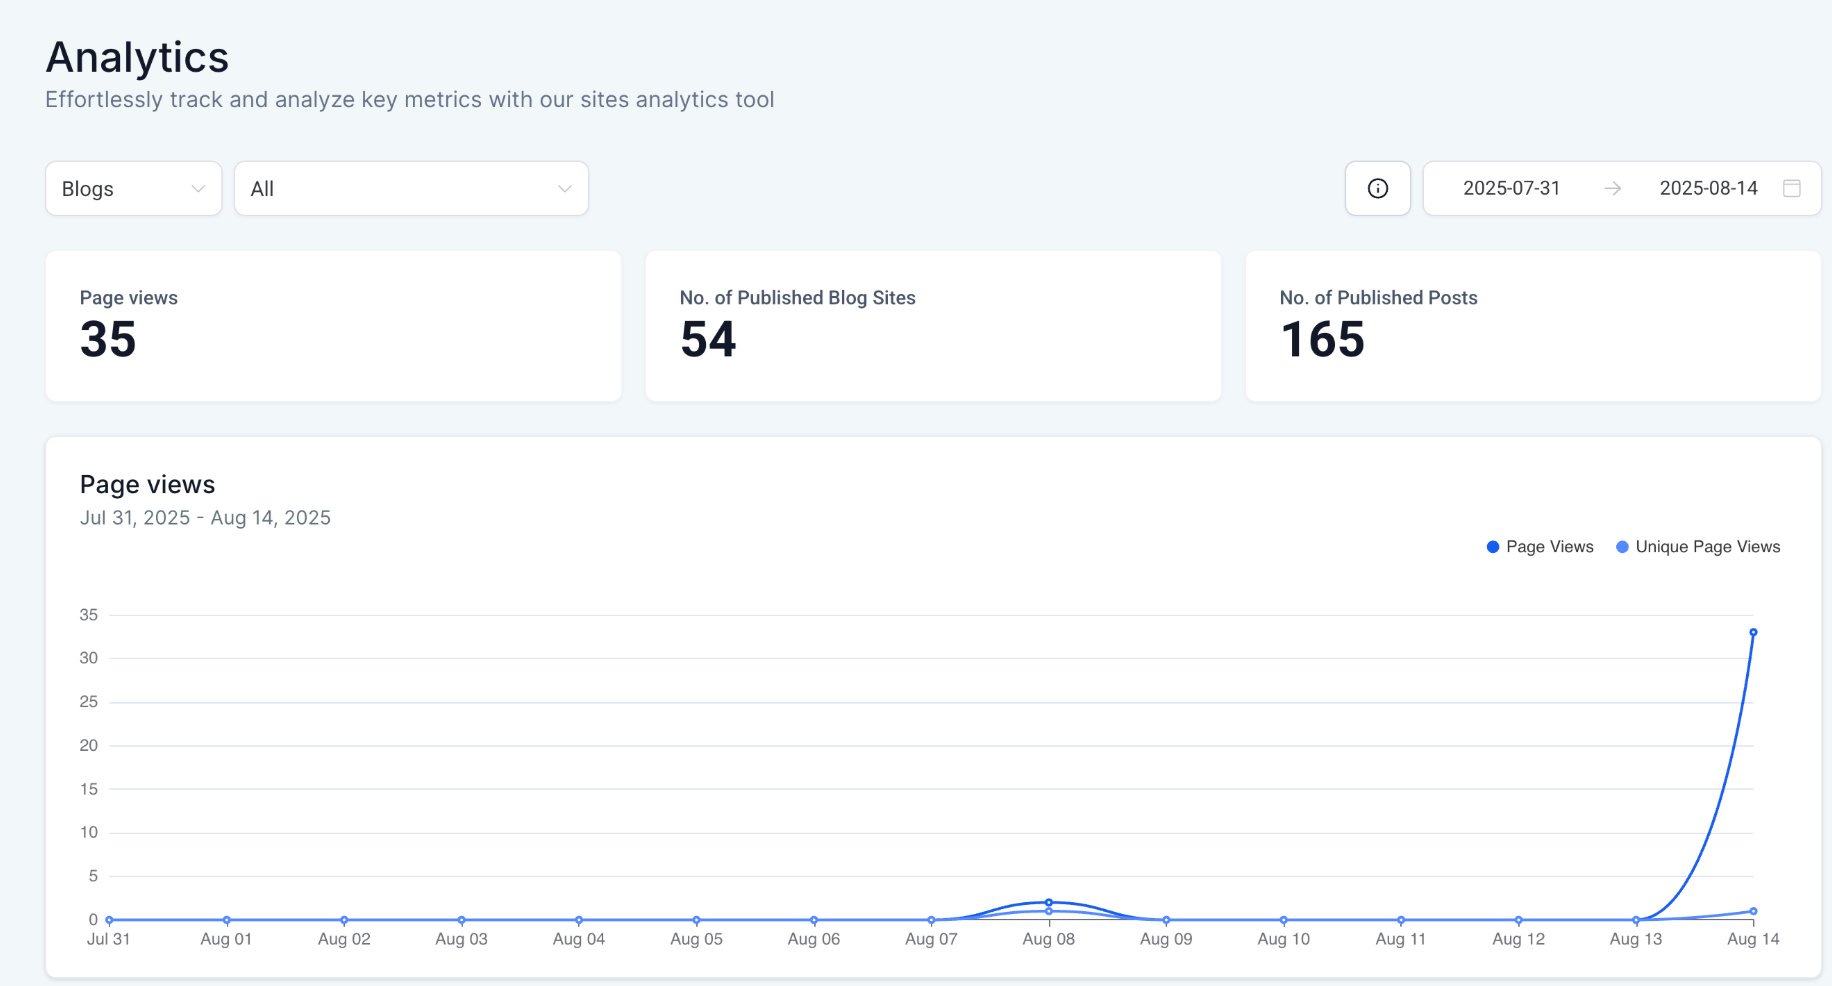
Graphical representation of page views over time
Flexible date range selection
Visual trend lines to analyze spikes, dips, and seasonal engagement
Top Performing Posts
Ranks posts by views and engagement
Displays thumbnails and titles for easy recognition
Helps identify which content resonates most with your audience
Link Click Tracking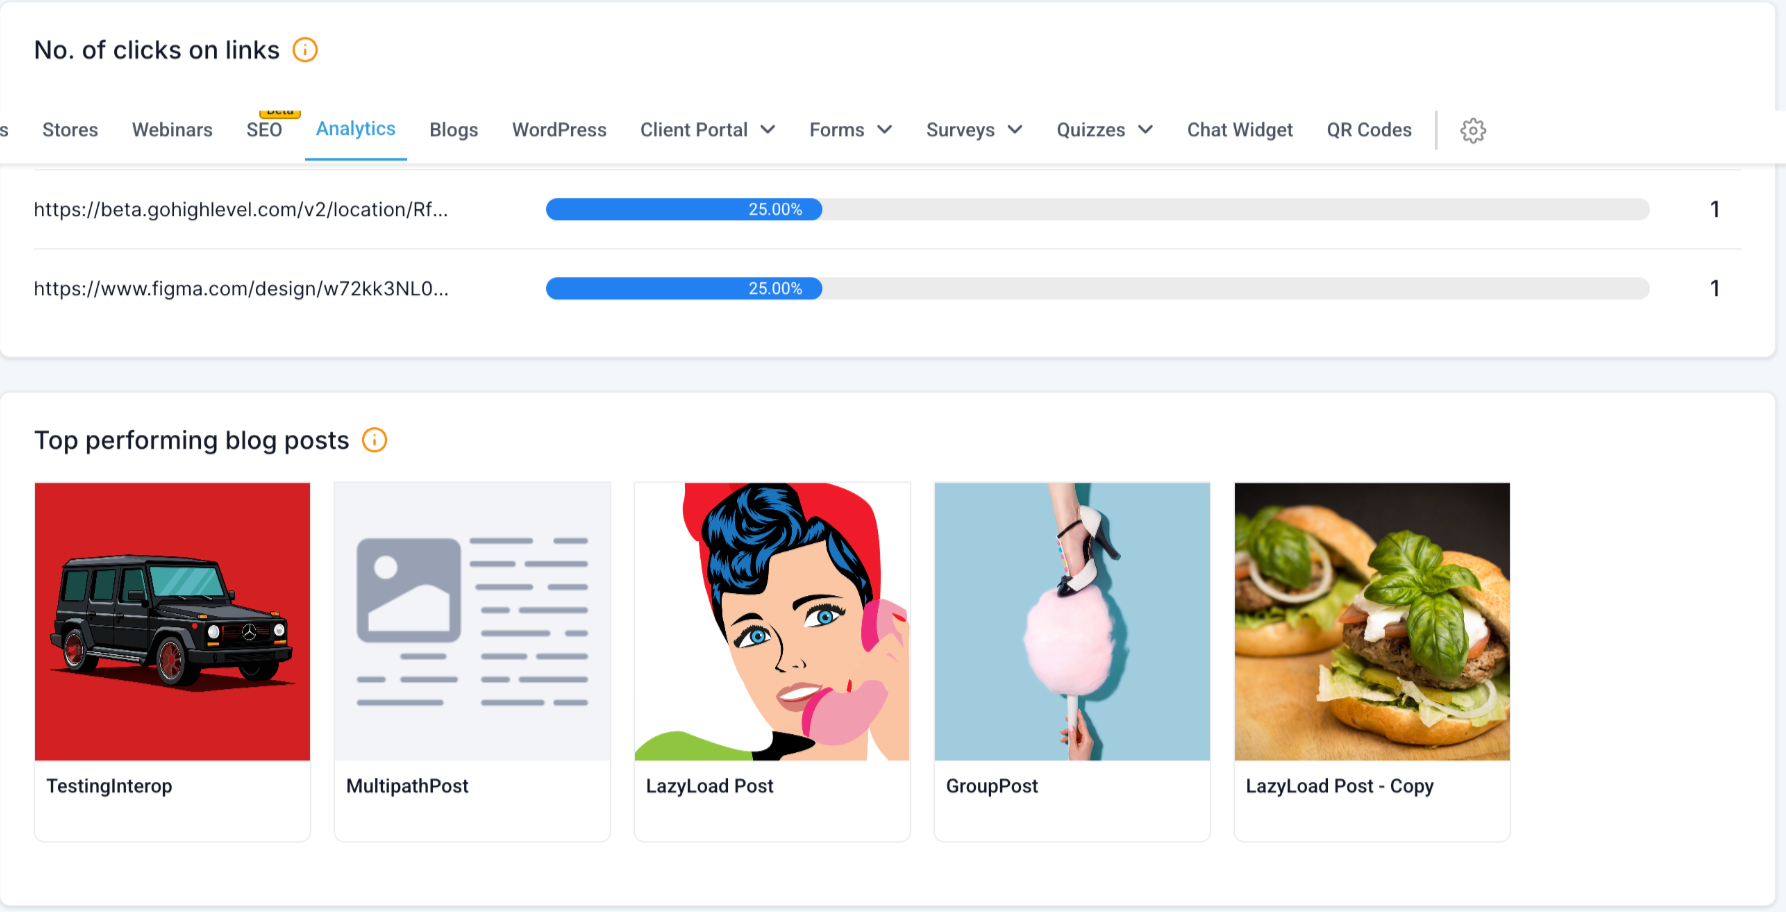
Tracks the number of clicks on in-post links
Measures effectiveness of calls-to-action and link placement
Device Breakdown
Segments traffic by device type (desktop, mobile, tablet)
Helps tailor the blog experience for each platform
Category Insights
Shows visits split by content category
Reveals which topics generate the most interest
Author Insights
Tracks clicks on author links
Measures individual contributor engagement and impact
Import vs. Manual Tracking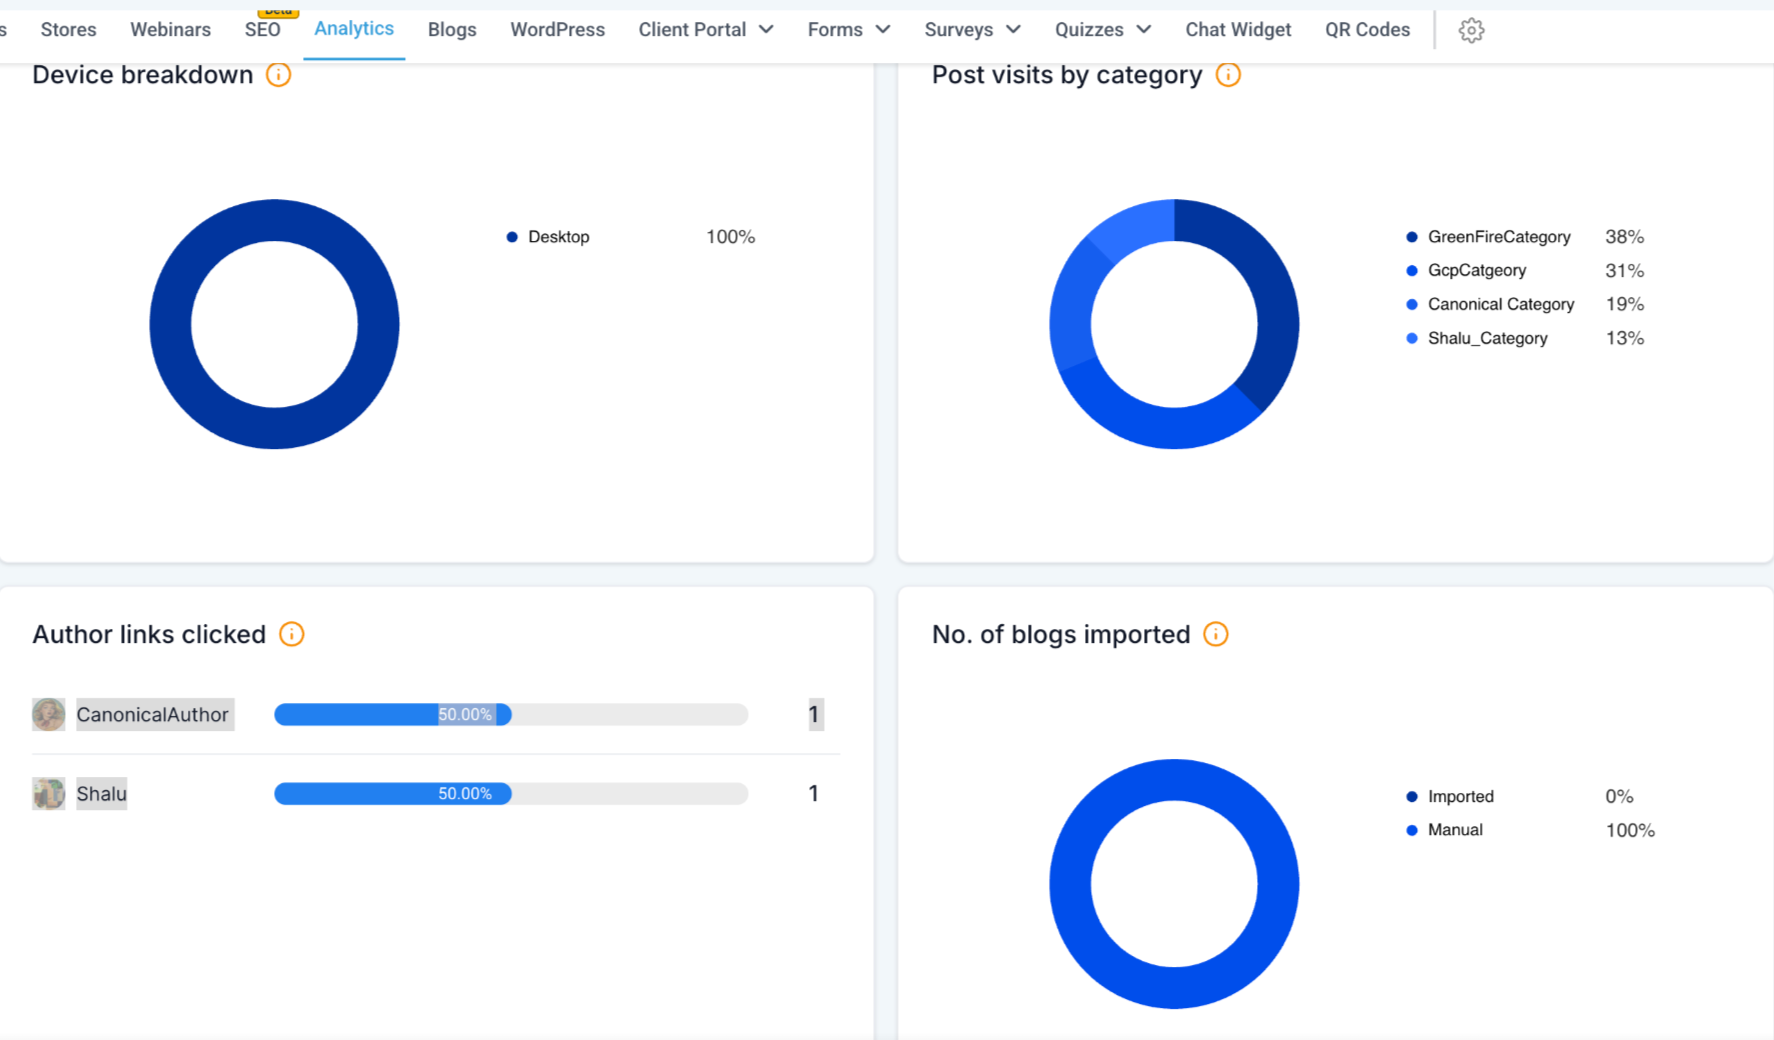
Compares imported vs. manually created posts
Highlights performance differences to guide future posting strategies
Why This Matters for Dance Studios
Studios can now clearly see which blog topics (e.g., recital tips, parent guides, costume care) attract the most attention. With this data, you can double down on high-performing posts, understand if parents read on mobile vs. desktop, and improve calls-to-action that drive class registrations.
Support
If you have questions or need help exploring Blog Statistics, please contact us at support@enrollio.ai.