
Enrollio's Ad Manager gives you a unified dashboard to track your LinkedIn ad performance alongside Meta and Google campaigns. With LinkedIn Statistics, you can monitor results at every level—from overall campaign groups down to individual ads.
This guide explains where to find LinkedIn statistics, what metrics are available, and how to interpret results for Lead Generation and Website Traffic campaigns.
Where to Find LinkedIn Statistics
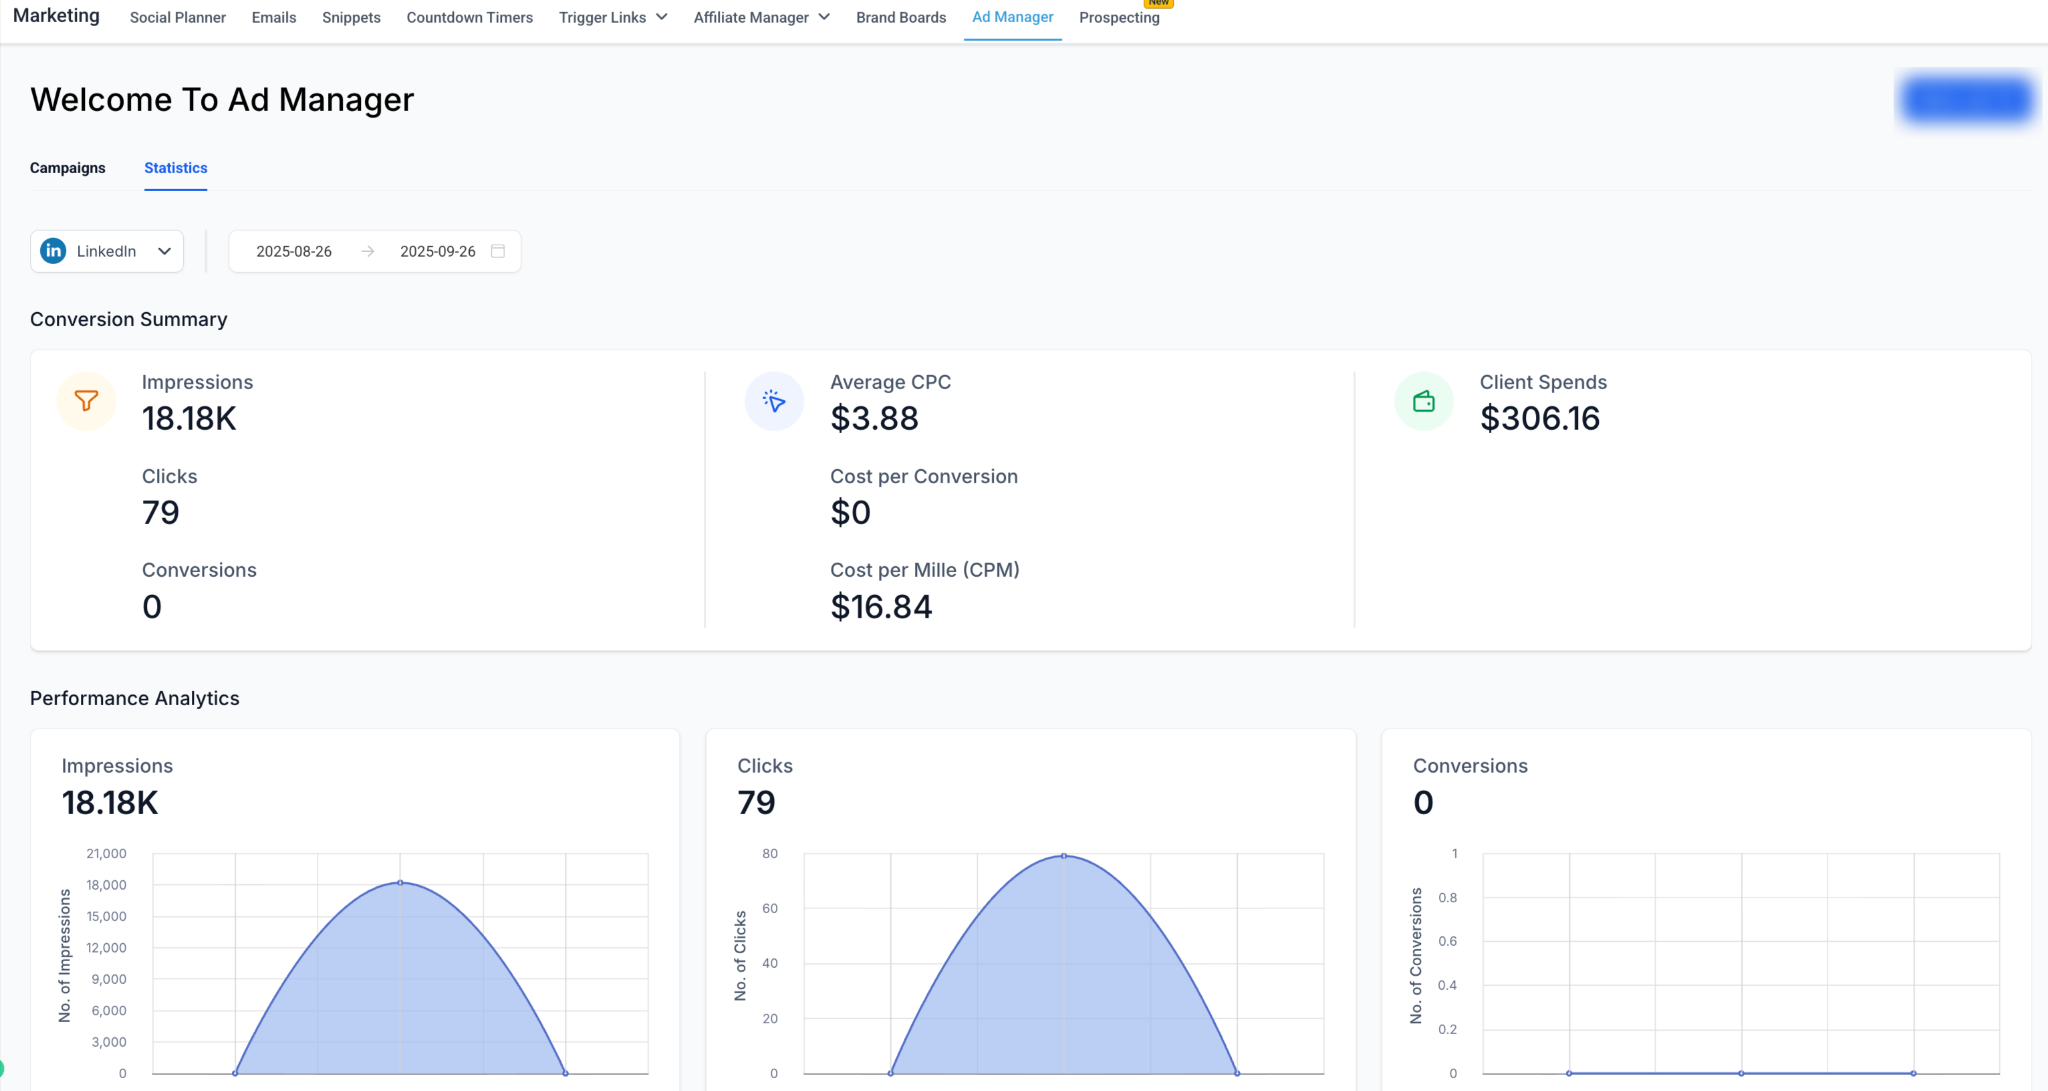
- Navigate to Marketing > Ad Manager
- Click the Statistics tab at the top left
- From the platform dropdown, select LinkedIn
- Choose a date range for the performance window you want to analyze
Statistics Hierarchy
LinkedIn data in Enrollio mirrors LinkedIn's own campaign structure. Understanding this hierarchy helps you drill down to see exactly where your results are coming from:
- Campaign Group: Equivalent to Meta Campaigns or Google Campaigns
- Campaign: Equivalent to Meta Ad Sets or Google Ad Groups
- Ad: Equivalent to Meta Ads or Google Ads
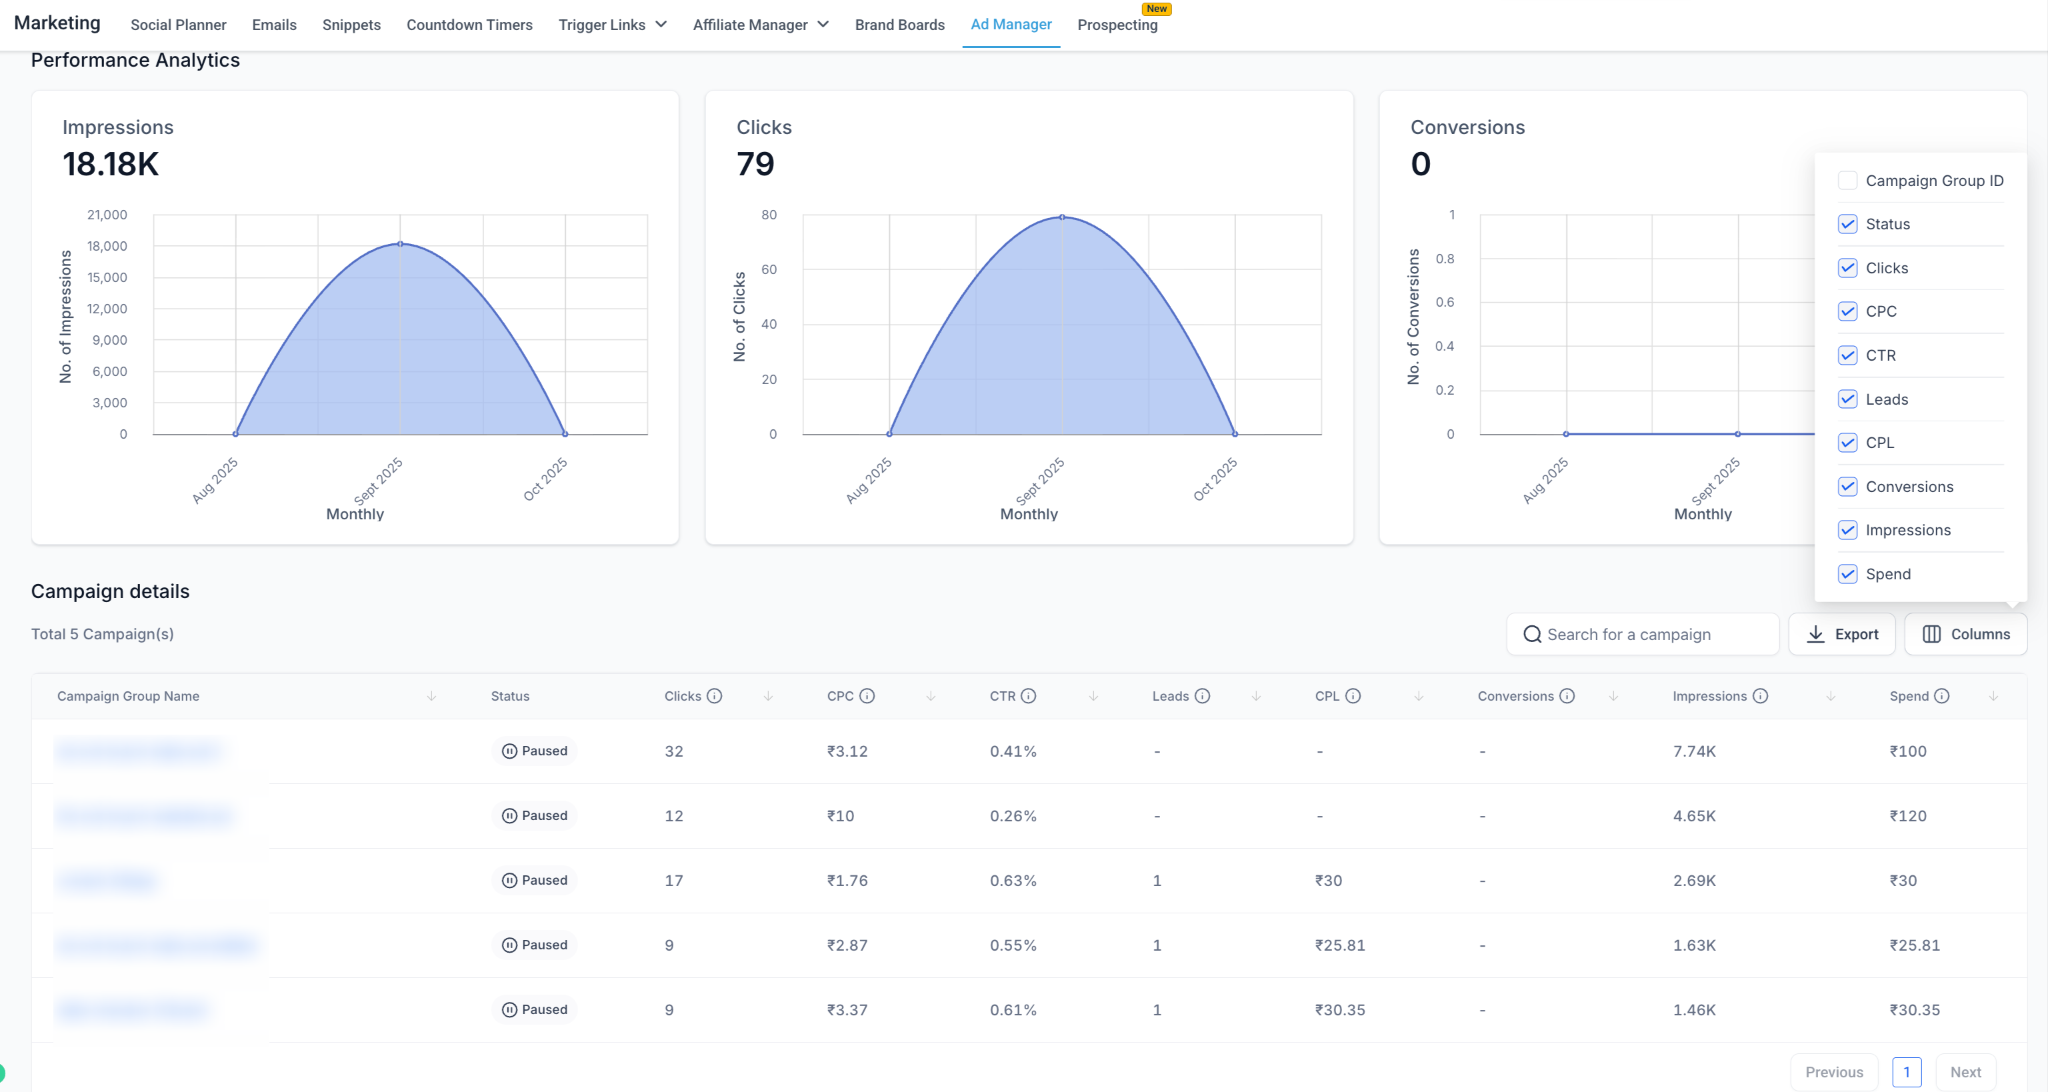
You can drill down from Campaign Group > Campaign > Ad to analyze performance at each level.
Metrics Overview
At the top of your statistics view, you'll see high-level metrics across all your campaign groups:
- Impressions: Total times your ads were displayed
- Clicks: Number of ad clicks
- Conversions: Actions taken (form submissions or website goals)
- Spend: Total spend in local currency
- Average CPC: Cost per click
- CPM: Cost per 1,000 impressions
- Cost per Conversion: Average cost to acquire each conversion
Performance Analytics (Trends Over Time)
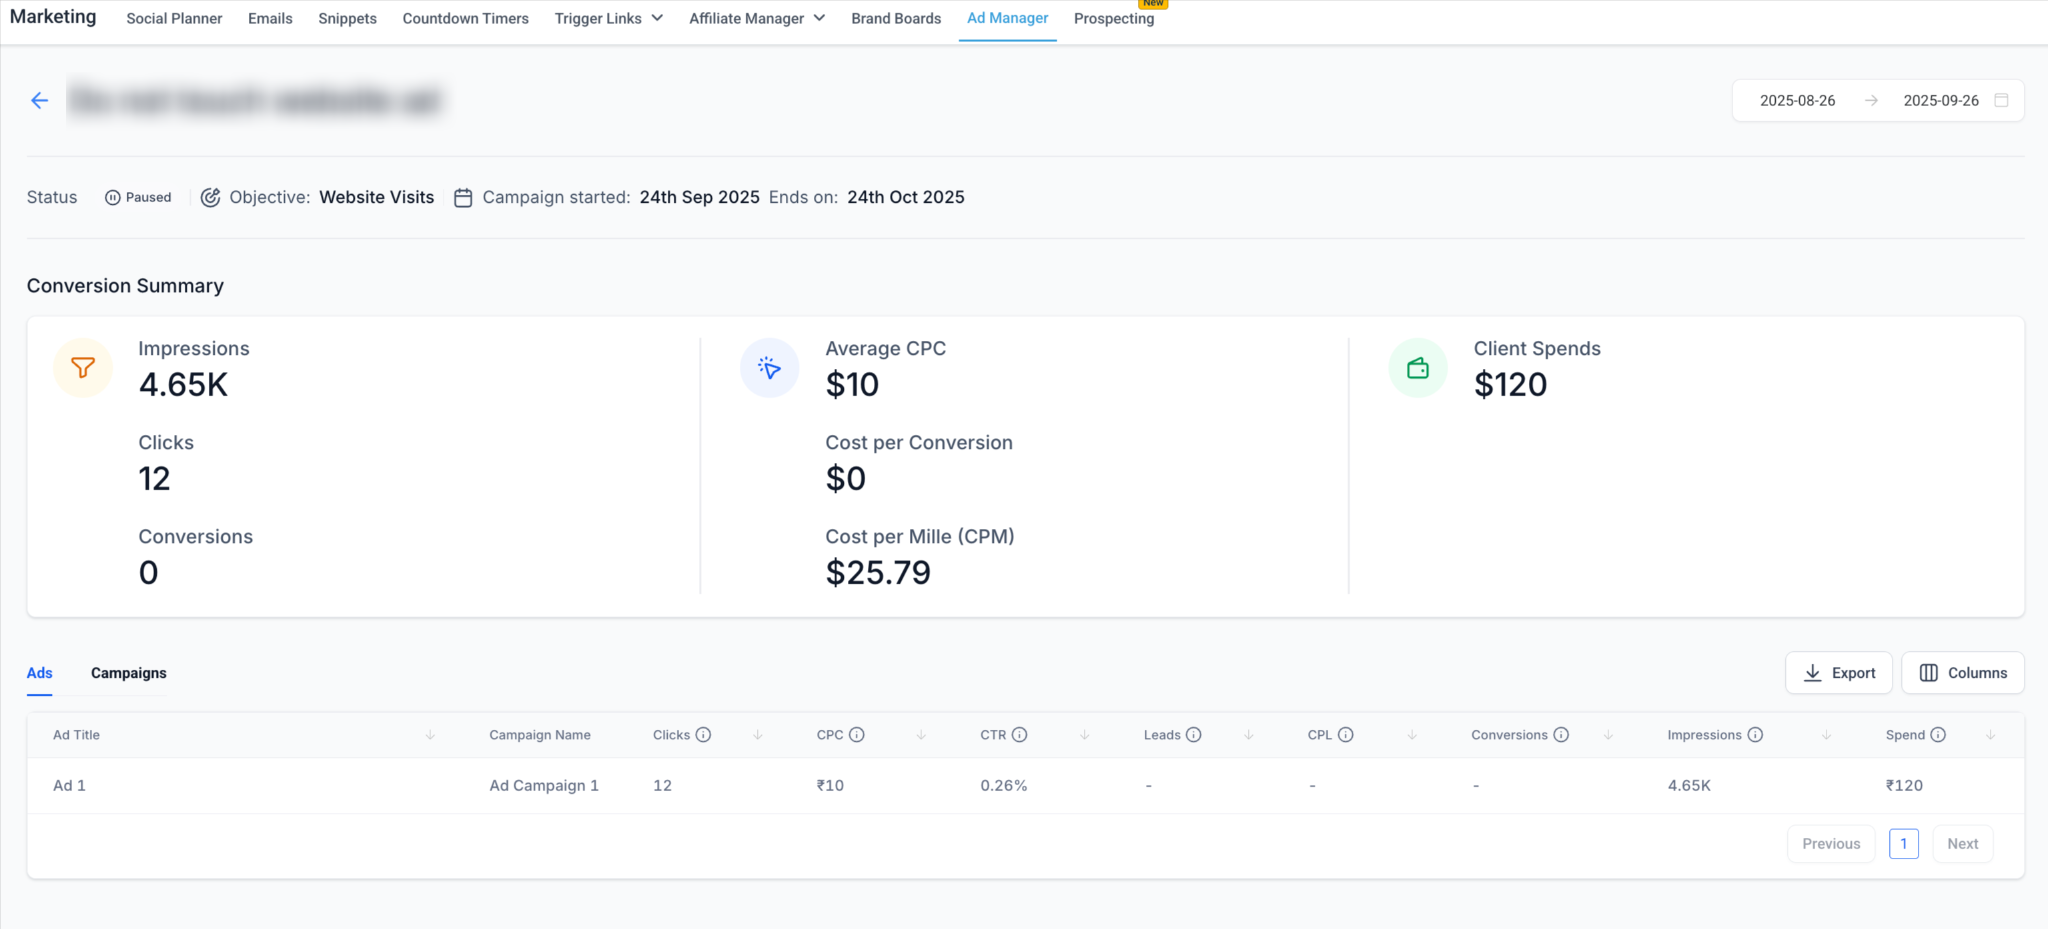
Visual graphs help you spot trends and patterns in your campaign performance:
- Impressions graph: See how your audience reach changes over time
- Clicks graph: Track engagement trends
- Conversions graph: Monitor conversion activity (lead submissions or website goals)
Use these graphs to identify what's working and when your ads perform best.
Detailed Metrics Tables
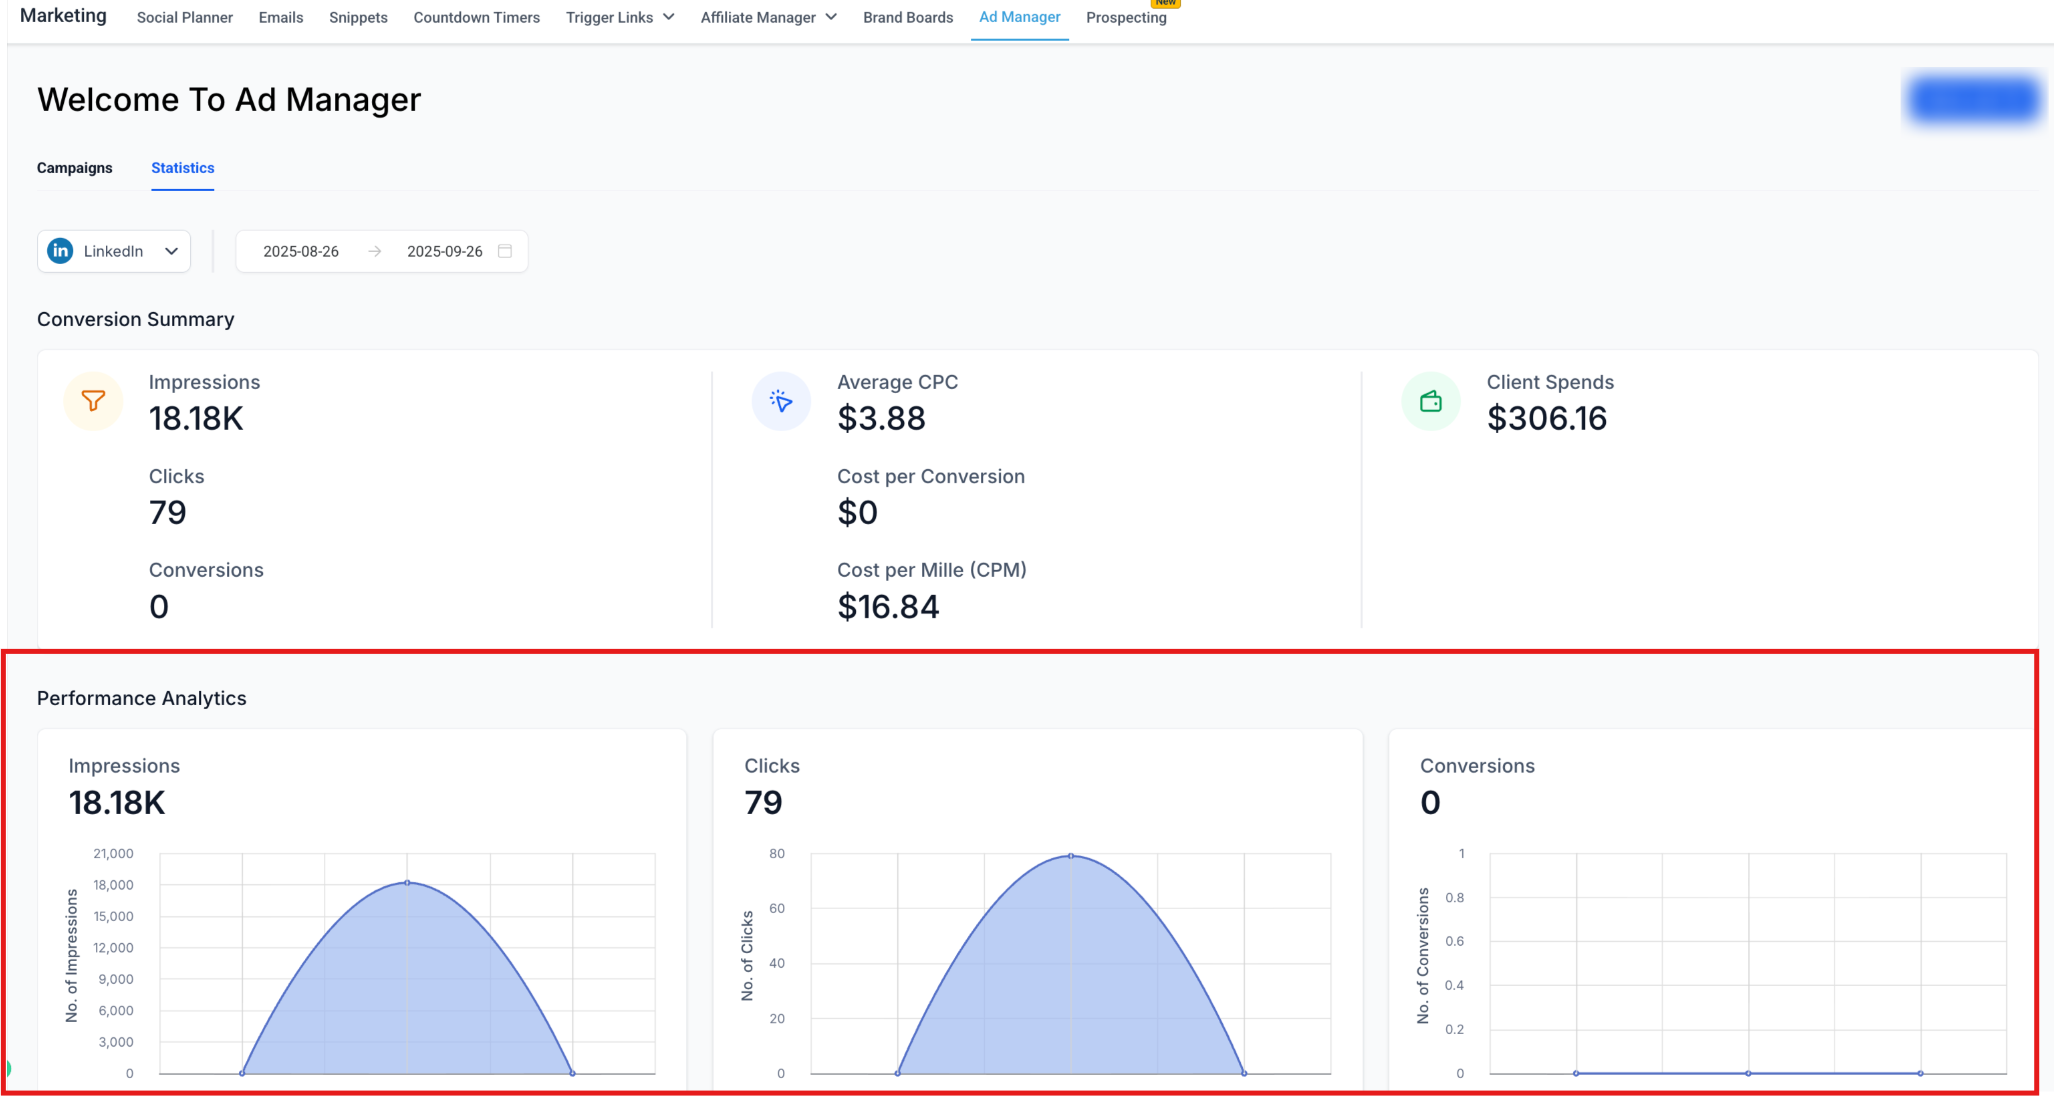
Each level (Group, Campaign, Ad) includes a detailed table with the following columns:
- Status: Active, Paused, or In Review
- Spend: Total amount spent
- Impressions: Number of ad views
- Clicks: Number of ad clicks
- CTR (Click-through Rate): Clicks ÷ Impressions (%)
- CPC (Cost per Click): Spend ÷ Clicks
- CPM (Cost per 1,000 impressions): Spend ÷ Impressions × 1,000
- Leads: Count of completed forms (Lead Gen campaigns only)
- CPL (Cost per Lead): Spend ÷ Leads (Lead Gen campaigns only)
- Conversions: Post-click actions (Website Traffic campaigns only)
- Cost per Conversion: Spend ÷ Conversions (Website Traffic campaigns only)
Metrics by Objective
Lead Generation Campaigns
Lead generation campaigns are designed to capture prospective families through form submissions. Your metrics focus on lead capture efficiency:
- Leads: Count of completed forms
- CPL (Cost per Lead): How efficiently you're capturing prospective families
- Conversion Rate: Leads ÷ Clicks (%)
You'll also see standard metrics: Status, Spend, Impressions, Clicks, CTR, CPC, and CPM.
Website Traffic Campaigns
Website traffic campaigns drive visitors to take actions on your enrollment site. Your metrics focus on website conversions:
- Conversions: Post-click actions like sign-ups, tour bookings, or downloads
- Cost per Conversion: Spend ÷ Conversions
You'll also see standard metrics: Status, Spend, Impressions, Clicks, CTR, CPC, and CPM.
How to Interpret Your Data
Impressions vs. Clicks
This comparison tells you whether your ad creative is engaging enough. High impressions with low clicks might mean your targeting is right but your ad needs work.
CTR (Click-through Rate)
A higher CTR means your ads resonate with your target audience. For childcare advertising, expect CTRs between 0.5% and 2% on LinkedIn.
CPC & CPM
These reflect your ad cost efficiency. Use them to compare performance across different campaigns and identify your most cost-effective approach.
Leads & CPL (Lead Gen campaigns)
These measure how efficiently you're capturing prospective families. Track your CPL over time to understand the true cost of filling your enrollment pipeline.
Conversions & Cost per Conversion (Traffic campaigns)
Track ROI for website campaigns. Compare this to your average enrollment value to ensure you're spending wisely.
Conversion Rate (Leads ÷ Clicks)
This evaluates both form quality and user intent. A low conversion rate might mean your form is too long or your targeting isn't specific enough.
Best Practices
Always check Status
Ads showing "In Review" won't deliver until LinkedIn approves them. Follow up if ads remain in review for more than 24 hours.
Use drilldowns to compare performance
Compare campaigns within the same group or ads within a campaign to identify your top performers.
Customize your view
Click the Columns button to add or remove metrics based on what matters most to your enrollment goals.
Export reports
Click Export to generate spreadsheets for deeper analysis or stakeholder reporting.
Monitor spend pacing
Ensure your budgets align with your enrollment goals. If you're spending too fast, you may need to adjust your targeting or bids.
Compare objectives strategically
Track CPL for Lead Gen campaigns and Cost per Conversion for Website Traffic campaigns. Each serves a different purpose in your enrollment funnel.