
Ad Manager - Tracking Your Campaign Performance
Running ads to attract families to your childcare center? The Statistics section in Ad Manager shows you exactly how your campaigns are performing, so you can make smart decisions about where to invest your marketing budget.
This guide walks you through monitoring your ad campaigns on Google and Facebook, understanding key metrics, and optimizing your spend to get more tours and enrollments.
What You'll Learn
- Why tracking ad performance matters for your childcare business
- Where to find campaign statistics in Ad Manager
- How to check overall performance across all campaigns
- How to dive into individual campaign details
- How to export prospective family data from your ads
- What each metric means and how to use it
Why Track Your Ad Campaign Statistics?
Monitoring your ad performance helps you:
- Understand what's working — See which ads are bringing in tour bookings and enrollment inquiries
- Measure your return — Know if your ad spend is paying off in new families
- Learn about your audience — Discover which parents are responding to your messaging
- Optimize campaigns — Make adjustments to improve results
- Allocate budget wisely — Spend more on what works, cut what doesn't
- Track enrollment goals — See if campaigns are meeting your targets for tours and enrollments
Finding the Statistics Section
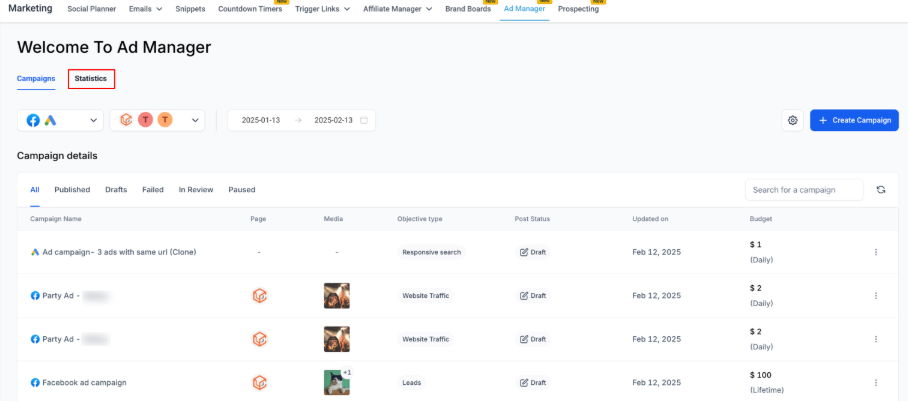
From the Ad Manager home screen, you'll see two tabs: Campaigns and Statistics.
Click the Statistics tab to view performance metrics for all your Published and Paused campaigns.
Viewing Overall Campaign Performance
When you open Statistics, you'll see performance analytics and conversion summaries for all your campaigns, plus a detailed table of metrics.
Filter by Platform
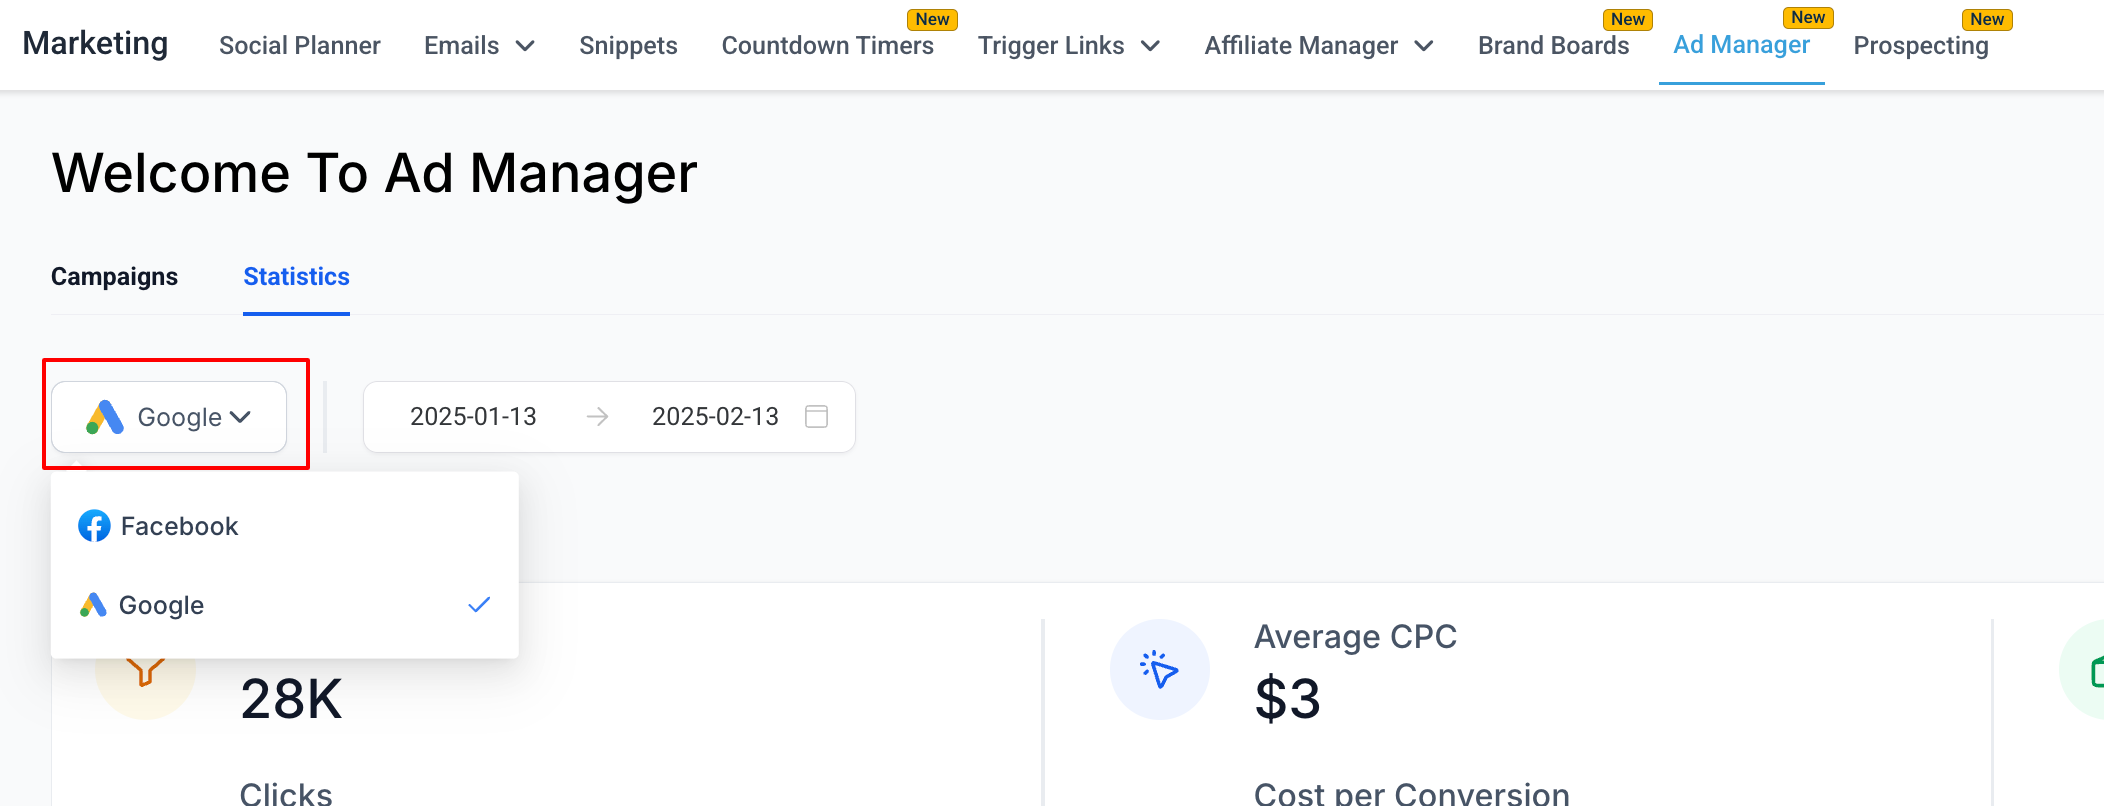
Click the filter at the top left to choose which platform's data you want to see:
- Google Ads — View performance for your Google campaigns
- Facebook Ads — View performance for your Facebook campaigns
When viewing Facebook campaigns, you can also filter by specific Facebook pages to narrow down your results.
Filter by Date Range
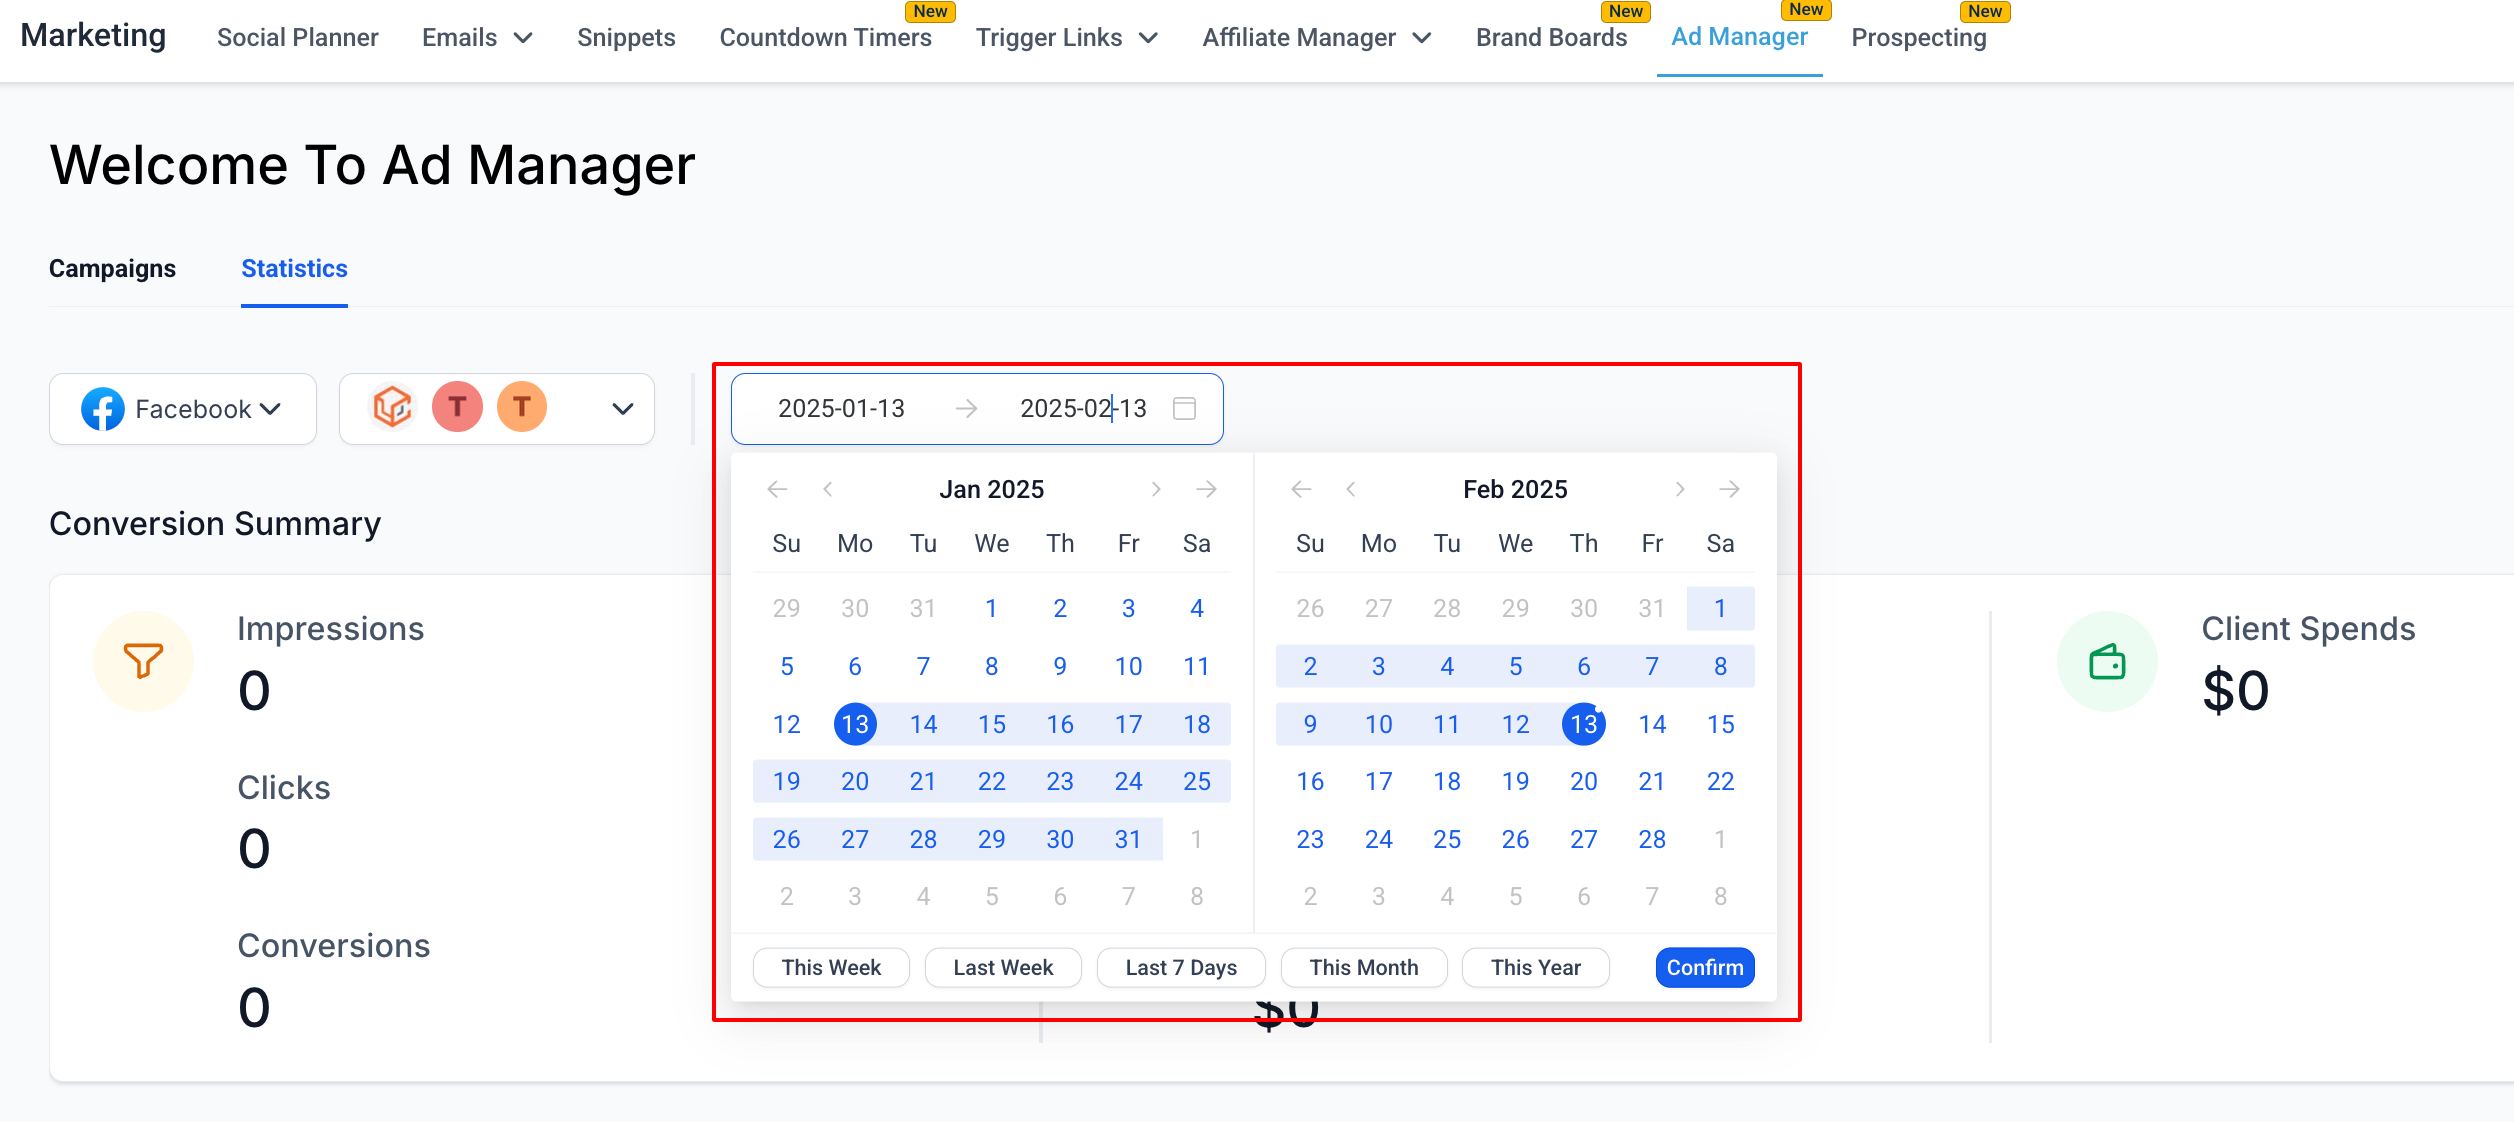
Select a custom date range to see statistics for a specific time period. This is helpful for comparing month-over-month performance or analyzing seasonal trends in family inquiries.
Filter by Page
For Facebook campaigns, use the page filter to view statistics for campaigns published on specific pages.
Customize Your View
You can choose which columns appear in the campaign table. This lets you focus on the metrics that matter most to your childcare center.
To customize columns:
- Click the columns selector in the table
- Check or uncheck metrics based on what you want to see
- Your view updates to show only the selected metrics
Analyze Facebook Campaigns Deeper
For Facebook campaigns, you can drill down to Ad Set and Ad level performance. This helps you identify which audience segments and creative approaches are bringing in the most families.
Viewing Individual Campaign Statistics
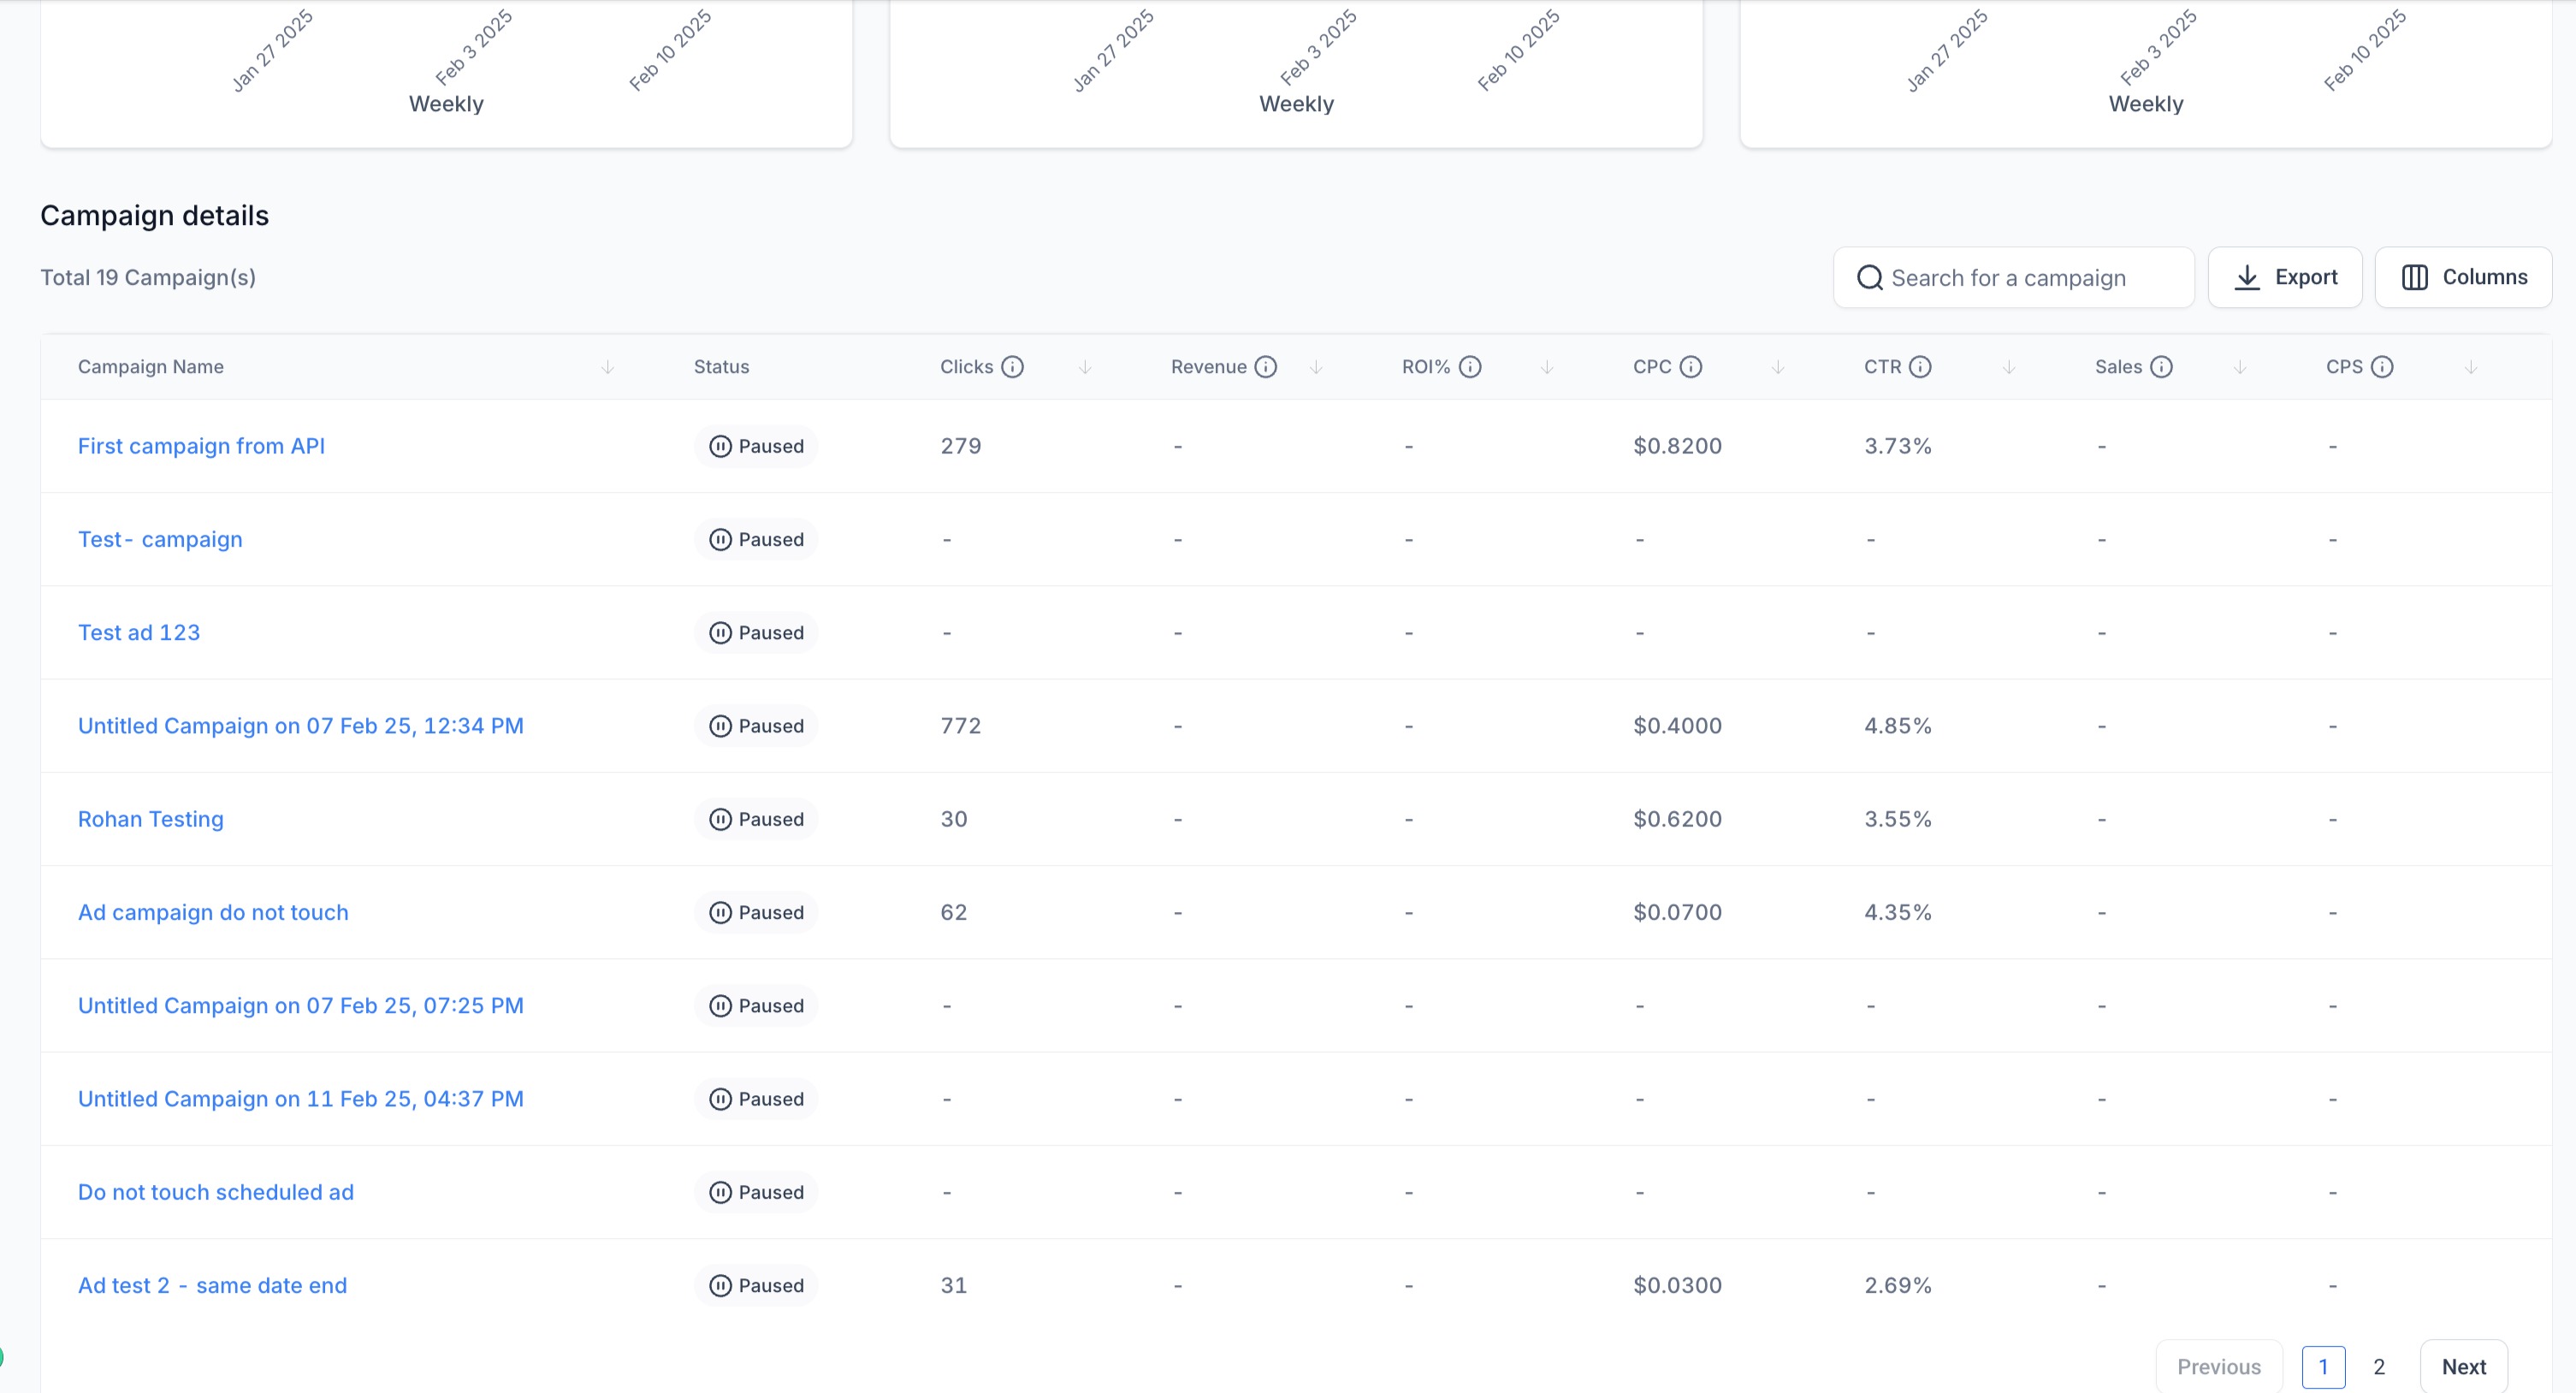
Want to see detailed performance for a specific campaign? Click any campaign name in the table to open its individual statistics page.
You'll see the same comprehensive metrics, but focused only on that campaign. The date filter and column customization options work here too.
For Facebook Campaigns
When viewing a Facebook campaign, you can drill into ad set and ad performance to see which audiences and creative elements drive the best results. This level of detail helps you optimize specific targeting and messaging.
Viewing and Exporting Prospective Family Data
When your campaigns generate prospective families or closed enrollments, you'll see the counts in your statistics table.
View Lead and Enrollment Details
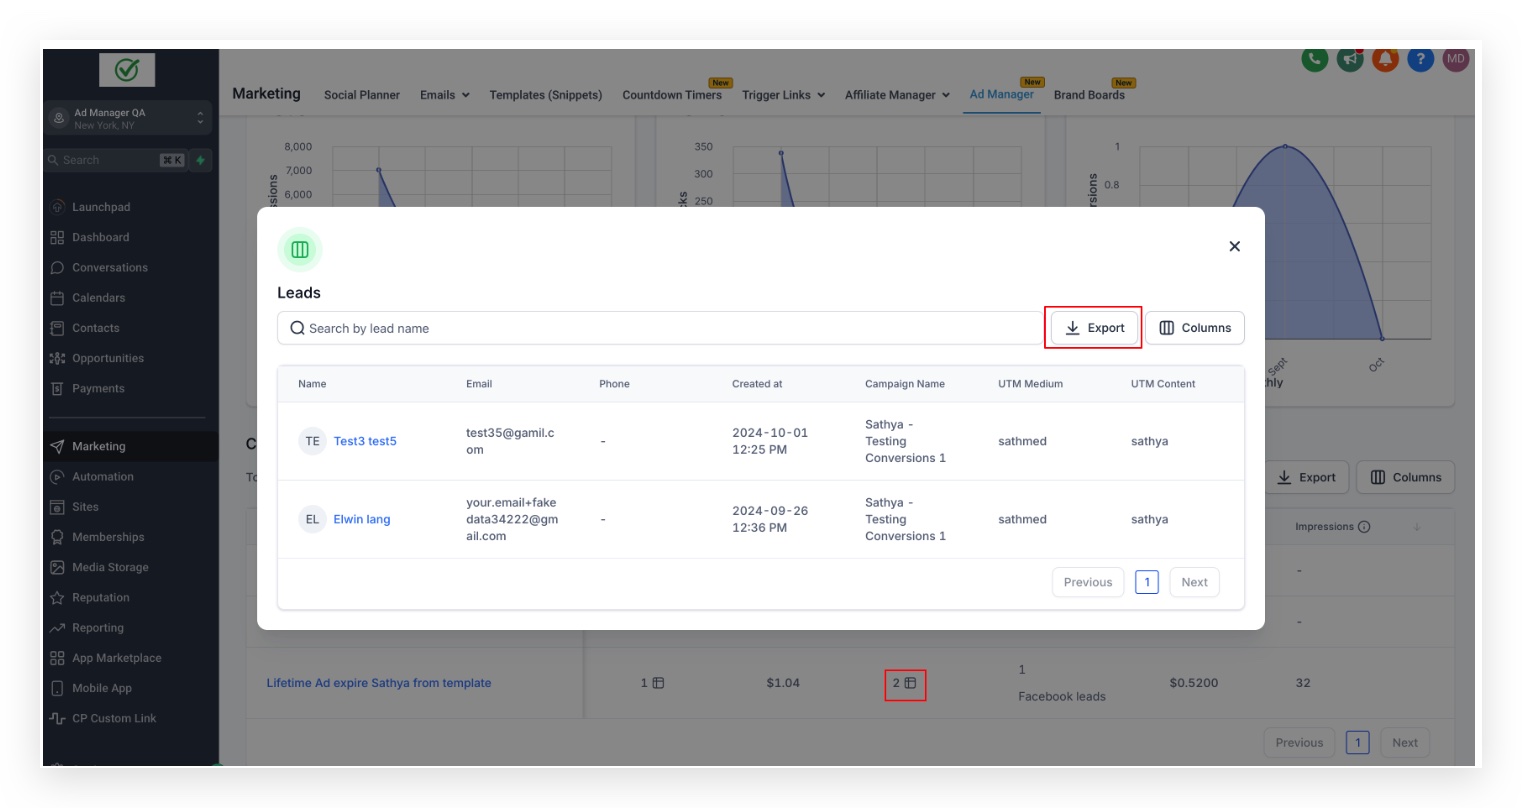
If the prospective families or enrollments count is greater than 0, you'll see a clickable icon next to the number.
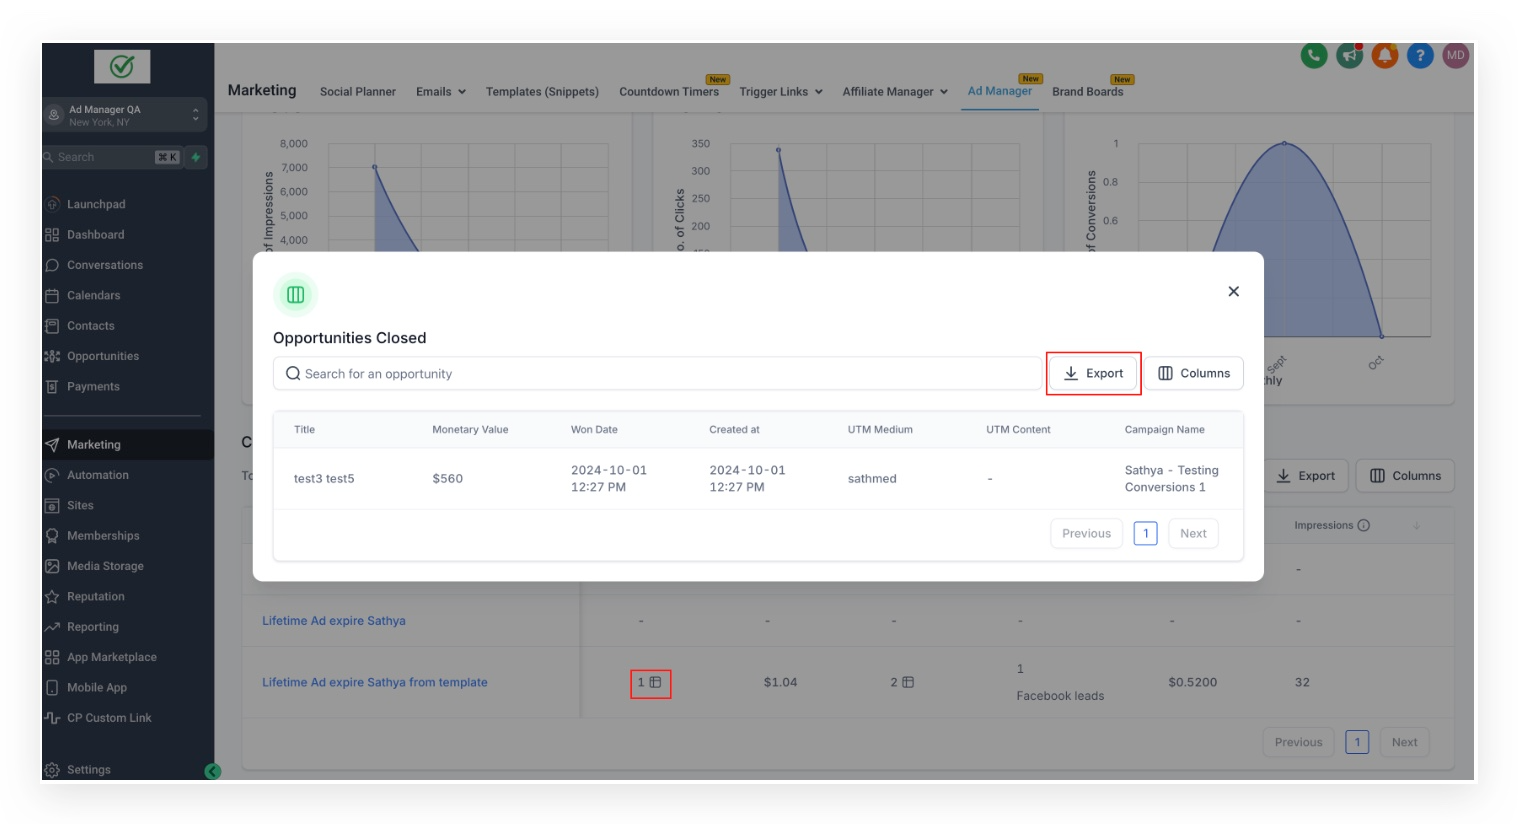
Click the icon to open a modal showing:
- Details of prospective families who inquired
- Information about enrollment opportunities that closed
Export Your Data
You can export both prospective family and enrollment data as CSV files. This is useful for importing into other systems or creating your own reports.
To export:
- Click the Export button in the modal
- Choose whether to export prospective families or enrollment opportunities
- The CSV file downloads to your computer
You can also export the entire campaign metrics table by clicking the Export button above the main table.
Understanding Campaign Metrics
The statistics table shows various metrics that help you understand campaign performance. Here's what each one means and why it matters for your childcare center:
Clicks
The total number of times parents clicked on your ad. More clicks typically mean your ad message and imagery are resonating with families.
Revenue
Total income generated from the campaign, measured through enrollments attributed to the ad. This shows the direct financial impact of your advertising.
ROI%
Return on Investment as a percentage. This measures how much return you're getting on your ad spend. A positive ROI means you're making more than you're spending.
CPC (Cost per Click)
The average amount you pay each time someone clicks your ad. Lower CPC means you're getting more clicks for your budget.
CTR (Click-Through Rate)
The percentage of people who clicked your ad after seeing it. A higher CTR indicates your ad is compelling to parents searching for childcare.
Sales
The total number of enrollments directly resulting from the campaign. This is your bottom-line metric for campaign success.
CPS (Cost per Sale)
The average cost to generate each enrollment. Calculate this by dividing total ad spend by number of enrollments. Lower is better.
Prospective Families
The number of families who showed interest by submitting their contact information for a tour or more information. These are warm prospects for enrollment.
Results
How many times your ad achieved its objective (set when you created the campaign). This could be website visits, form submissions, or other goals.
CPL (Cost per Lead)
The average cost to acquire each prospective family contact. Divide total ad spend by number of prospective families generated.
Impressions
How many times your ad was displayed, whether or not it was clicked. This measures your ad's visibility to parents.
Spend
The total amount you've invested in the campaign so far. Keep this number in mind when evaluating ROI.
Reach
The number of unique parents who saw your ad at least once. This shows how many different families you're reaching.
Frequency
How many times, on average, each unique parent saw your ad (calculated as Impressions divided by Reach). Too high might mean you're over-exposing the same people.
Frequently Asked Questions
What key metrics should I track in Ad Manager?
Track impressions, clicks, conversions, click-through rate (CTR), cost per click (CPC), cost per lead (CPL), cost per sale (CPS), and return on ad spend (ROI%). For childcare centers, focus especially on prospective families generated and enrollments closed.
How often are statistics updated?
Campaign statistics update in real-time, so you can monitor performance and make adjustments as needed throughout the day.
Can I filter statistics by specific time periods?
Yes, use the date range filter to analyze campaign performance over any custom time period. This helps you track seasonal trends or compare month-to-month results.
What should I do if my ad performance is below expectations?
Review your targeting, ad creative, and messaging. Consider testing different images, headlines, or audience segments. You can also pause underperforming campaigns and reallocate budget to better-performing ones.
Can I see which specific families came from each campaign?
Yes. Click the prospective families icon next to any campaign with leads to view details about who inquired. You can export this data as a CSV for further analysis.
How do I know which campaigns are worth continuing?
Look at ROI% and cost per enrollment. If a campaign has positive ROI and reasonable cost per enrollment compared to your tuition rates, it's likely worth continuing. Also consider the quality of inquiries, not just quantity.