
What is Blog Analytics?
Blog Analytics gives you a clear view of how your childcare blog is performing. Track page views, see which posts resonate with families, and understand how parents engage with your content—all in one place.
Whether you're sharing enrollment updates, childcare tips, or center news, these insights help you create content that connects with your audience.
Why Blog Analytics Matter for Your Center
Blog Analytics helps you make smarter content decisions:
- See what works: Quickly identify which posts get the most views and engagement
- Know your audience: Understand whether families read on mobile or desktop
- Track engagement: Monitor which links parents click to gauge interest
- Plan better content: Use category insights to focus on topics families care about
- Save time: Stop guessing—let the data guide your content strategy
How to Access Blog Analytics
Note: Data is available starting August 28, 2024. Activity before this date will show as "Unknown."
- Log in to your Client Account
- Click Sites
- Click the Analytics tab
- Click the category selector dropdown and choose Blogs
- Wait for the dashboard to load
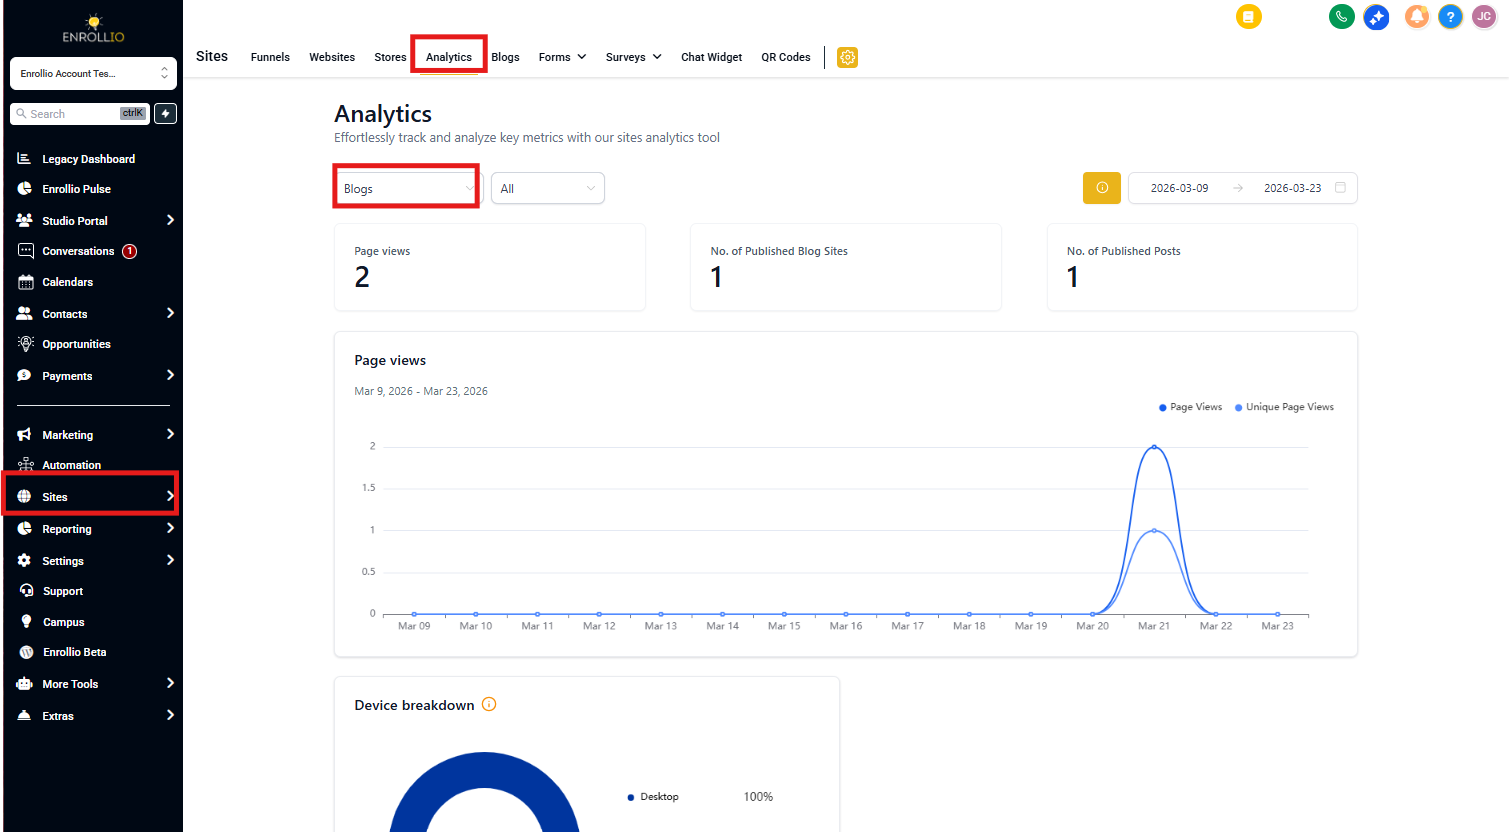
Use the date range selector and blog site selector at the top to filter your data. This lets you focus on specific time periods or individual blog sites if you have multiple.
Understanding Your Blog Performance
Quick Performance Overview
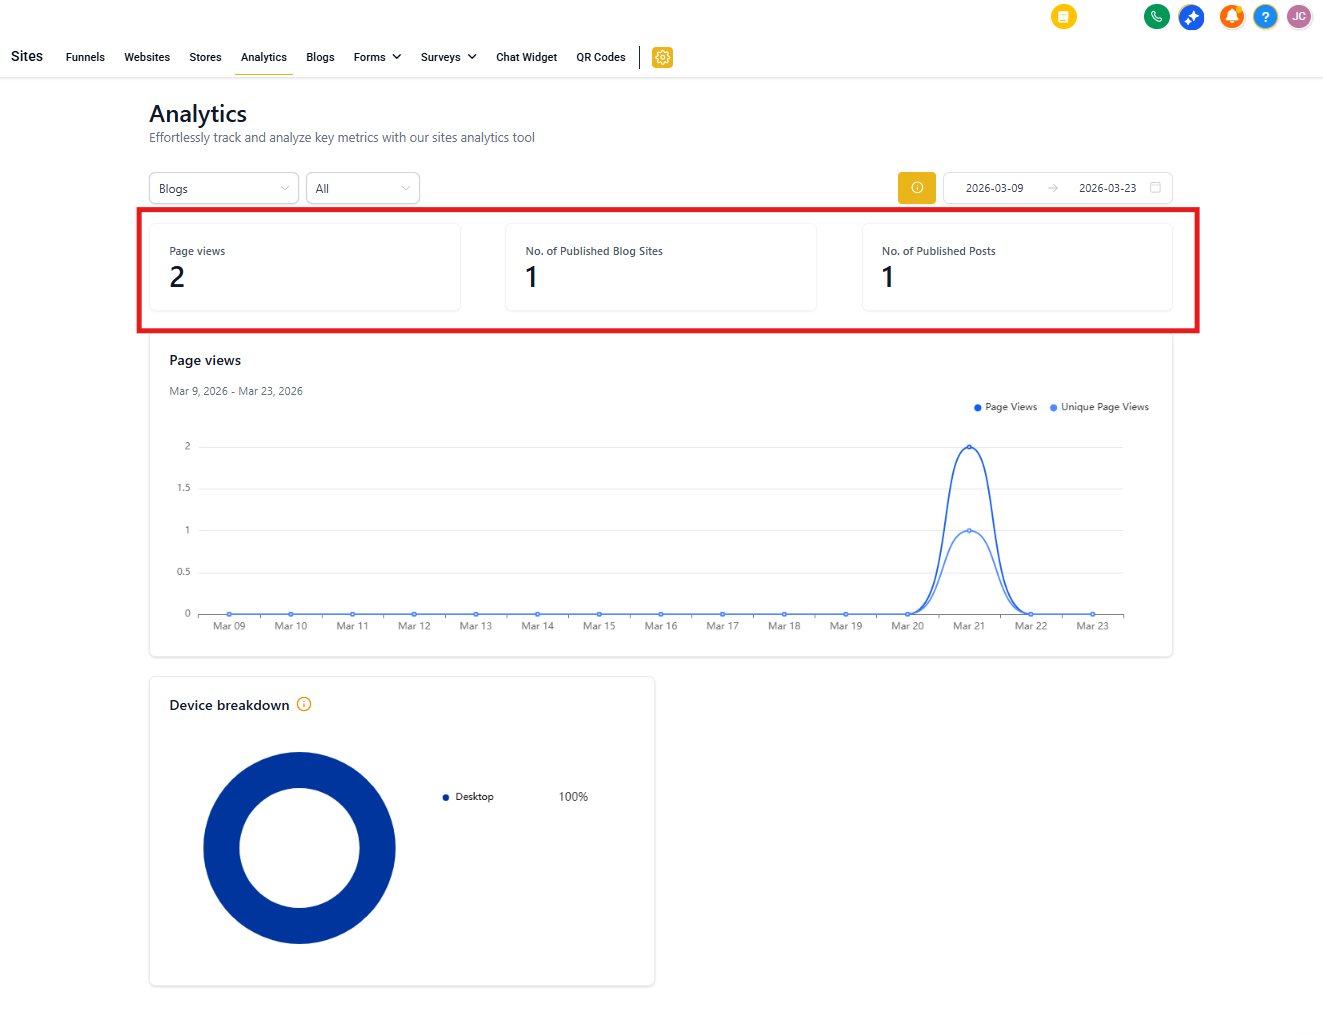
This section shows your blog's health at a glance:
- Total page views: How many times parents have viewed your blog posts
- Published blog sites: Number of active blogs you're running
- Published posts: Total posts live on your site
Trends Over Time
This graph shows how your page views change over your selected date range. Look for patterns like:
- Spikes when you publish popular content
- Weekly patterns (parents might read more on weekends)
- Seasonal changes (higher engagement during enrollment periods)
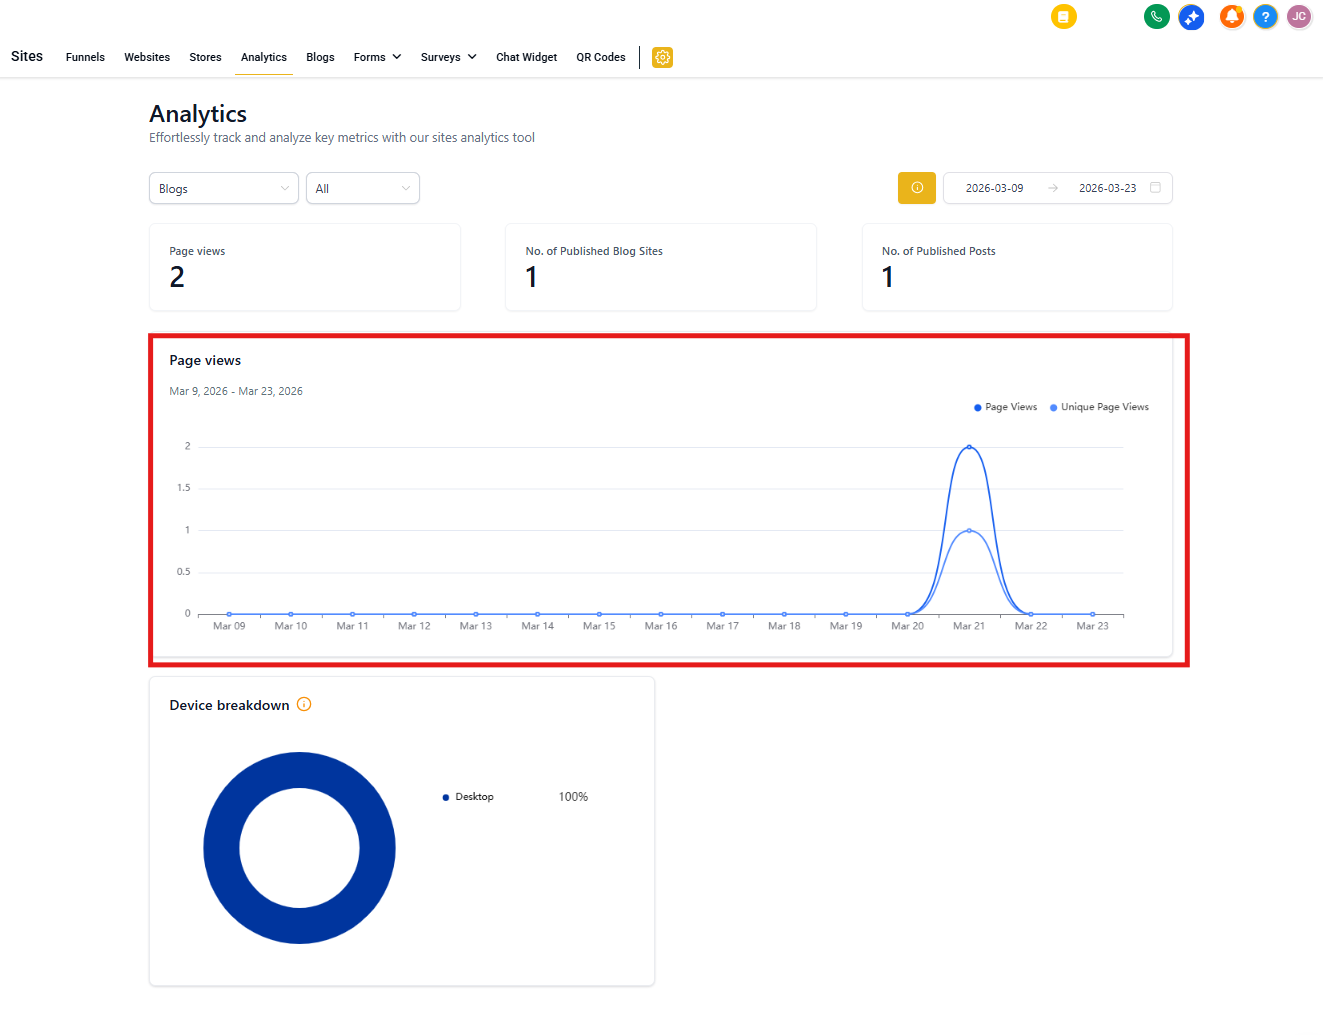
Use this to time your most important posts—like enrollment announcements—when engagement is naturally higher.
Top Performing Posts
See which blog posts get the most views and engagement. Each post displays with a thumbnail and title, ranked by performance.
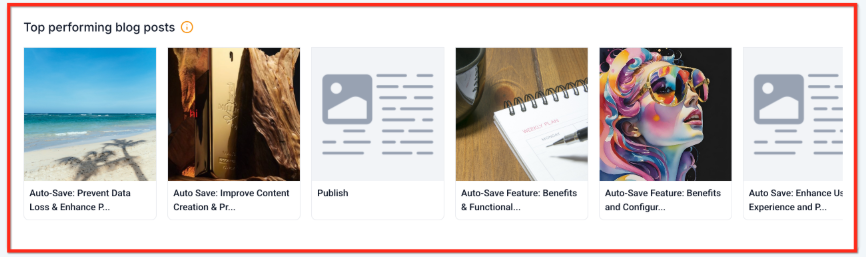
Use this to:
- Identify topics that resonate with families
- Create more content on similar themes
- Update and republish successful older posts
Link Clicks
Track which links in your blog posts get clicked. This shows you:
- Whether families click your "Schedule a Tour" calls-to-action
- Which resources parents find most valuable
- If your link placements are working
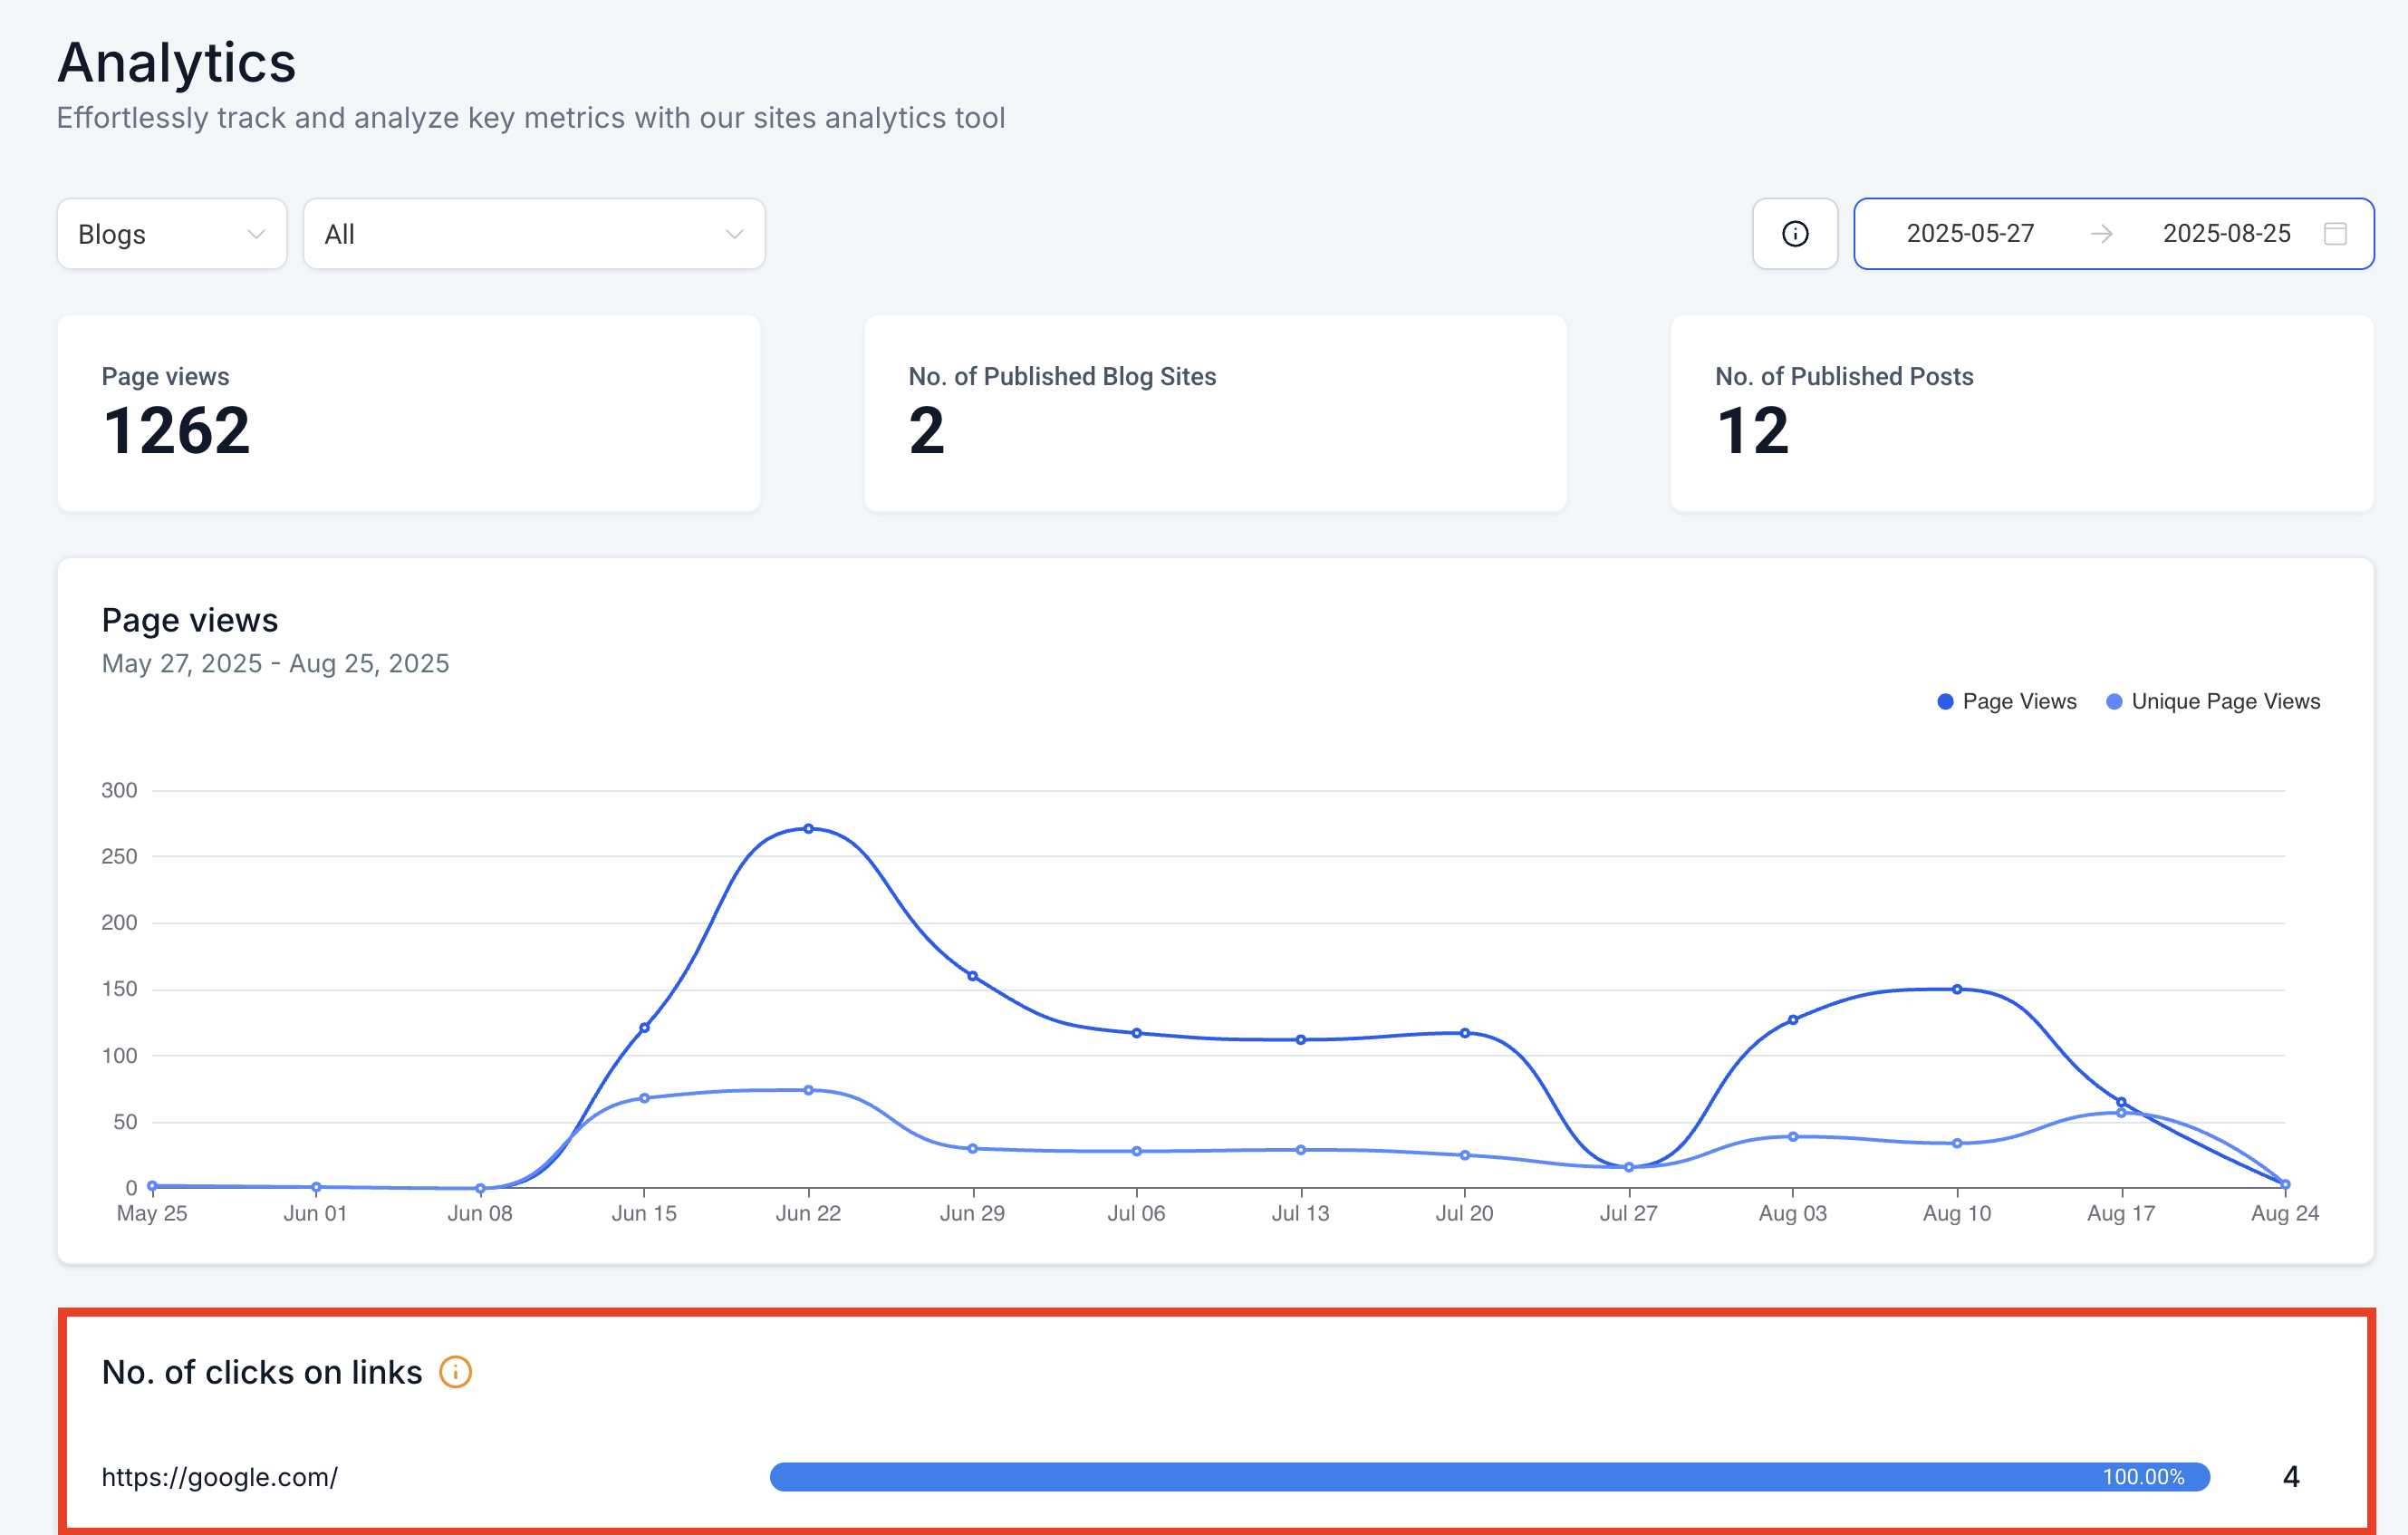
Low click rates? Try making your calls-to-action more prominent or placing them earlier in your posts.
Device Breakdown
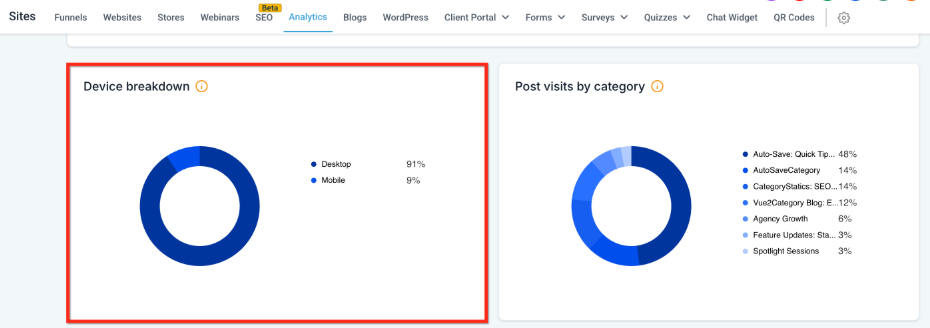
See whether families read your blog on desktop, mobile, or tablet. This matters because:
- If most parents use mobile, ensure your blog loads fast and looks great on phones
- Long-form content works better on desktop
- Mobile readers prefer shorter paragraphs and clear formatting
Post Visits by Category
This breaks down which content categories get the most attention. If "Enrollment Tips" gets more views than "Staff Updates," you know where to focus your efforts.
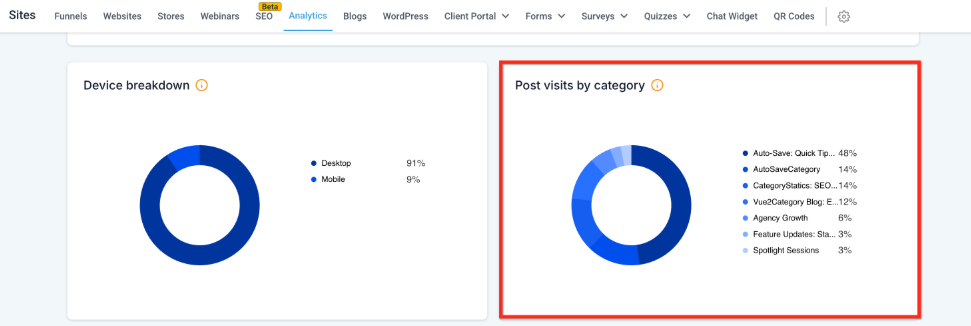
Use these insights to:
- Plan your content calendar around popular topics
- Phase out underperforming categories
- Create series around high-interest themes
Author Performance
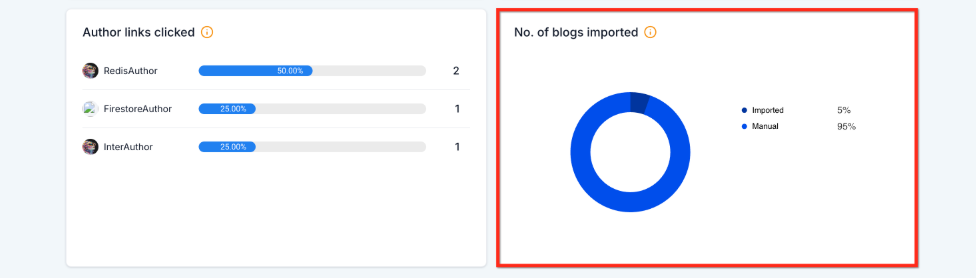
If multiple team members contribute to your blog, track which authors drive the most engagement through their author link clicks.
This helps you:
- Recognize high-performing contributors
- Identify which staff voices resonate with families
- Make collaborative content decisions
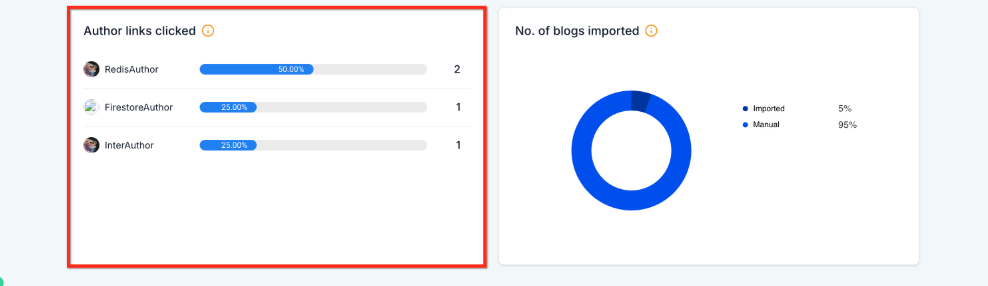
Import vs. Manual Posts
Compare performance between posts you imported from other sources and posts you created directly in Enrollio.
This tells you:
- Whether imported content performs as well as original posts
- If your manual content creation efforts are worth it
- How to balance content curation with original writing
Making Blog Analytics Work for You
Here's how to turn these insights into action:
- Weekly check-in: Review your Quick Performance Overview every Monday
- Monthly deep dive: Analyze trends, top posts, and categories to plan next month's content
- Replicate success: When a post performs well, create similar content or update it seasonally
- Fix what's broken: Low link clicks? Test new call-to-action placements
- Mobile-first: If most families read on mobile, keep paragraphs short and use more headings
Frequently Asked Questions
Who can access Blog Analytics?
Blog Analytics are available to all Enrollio users across all plans.
When does data collection start?
Blog Analytics data is available starting August 28, 2024. Any activity before this date appears as "Unknown" in reports.
How do I filter data by date range?
Click the date range selector at the top of the dashboard. Choose from preset ranges or select custom dates.
Is the data updated in real time?
Data refreshes regularly throughout the day, but there may be a slight delay due to processing. For most accurate insights, check your analytics a few hours after publishing new content.
What if I have multiple blog sites?
Use the blog site selector dropdown to switch between different blogs or view combined data across all sites.
How often should I check my blog analytics?
Check your Quick Performance Overview weekly and do a detailed review monthly. This gives you enough data to spot trends without getting lost in daily fluctuations.