
Facebook Ad Reporting gives you live insights into your childcare center's digital ad campaigns. With clear, big-picture analysis, you can quickly understand how your ads are performing and make smart decisions to grow your enrollment ROI.
This article covers the key metrics you'll see in your Facebook Ad reports:
Impressions
An impression is counted each time your ad is displayed on a search results page or another site within the Facebook network. Think of it as how many times your ad appeared in front of potential families.
Clicks
When someone clicks your ad — whether it's the headline, phone number, or call-to-action button — Facebook counts that as a click. This shows how many people took action after seeing your ad.
Conversions
A conversion is any interaction that results in a valuable action for your childcare center. This could happen on your enrollment site, landing page, Facebook page, or app.
Common conversions for childcare businesses include:
- Tour request form submissions
- Newsletter signups
- Enrollment application submissions
- Resource downloads (like your parent handbook)
- Facebook Lead Ad responses
You define what counts as a conversion based on your enrollment goals. The ultimate aim is turning interested parents into enrolled families.
Client Spend
This is the total cost of running your ad campaign, including Facebook ad costs and any management fees. This metric is only visible to Enrollio administrators.
Average CPC (Cost per Click)
CPC is the average amount you pay each time someone clicks your ad. The higher your CPC, the more expensive each click becomes.
Your CPC can vary based on several factors:
- Your advertising budget
- Number of impressions
- Geographic location and time of day
- Type of content in your ad
- Competition in your local market
Cost Per Conversion (CPA)
Also known as Cost per Acquisition, CPA measures the average cost of acquiring one new prospective family. Calculate it by dividing your total ad spend by the total number of conversions.
For example: If you spent $500 on ads and got 25 tour requests, your CPA is $20 per tour request.
Conversion Rate
Your conversion rate shows what percentage of people who saw or clicked your ad actually converted.
Calculate it by dividing conversions by total ad interactions, then multiply by 100. For example: 50 conversions from 1,000 clicks = 5% conversion rate (50 ÷ 1,000 = 0.05 or 5%).
Revenue
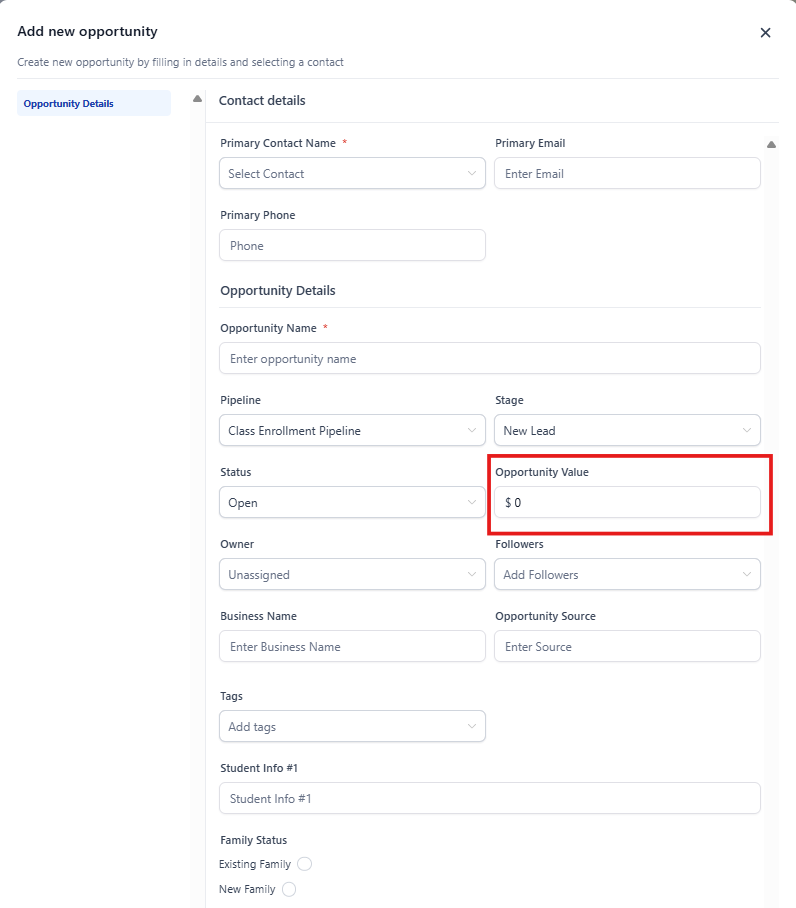
When you mark an enrollment opportunity as won in Enrollio, you can add a monetary value to track your total enrollment revenue. Revenue is the sum of all won enrollment opportunities from a specific Facebook ad campaign.
Pro tip: When adding a value to your enrollment opportunities, only use numbers — no dollar signs. The currency formatting is already built into the field.
ROI (Return on Investment)
ROI measures how much revenue you generated compared to what you spent on advertising. It's calculated by comparing the costs of your ad campaign to the revenue it generated.
You can view ROI for individual ads or for your entire campaign. This helps you identify which ads are bringing in the most enrollments for your investment.
Sales
In Enrollio, "Sales" refers to enrollment opportunities that have been marked as won — meaning families who have completed enrollment at your center.
CPS (Cost per Sale)
CPS shows how much you spent to acquire each completed enrollment. Calculate it by dividing your campaign cost by the number of enrollment opportunities marked as won.
For example: If you spent $1,000 and enrolled 10 new families, your CPS is $100 per enrollment.
Leads
Leads are prospective families who have expressed interest by submitting a form, responding via chat, or calling your center. In Enrollio, these appear as enrollment opportunities in the "open" stage.
CPL (Cost per Lead)
CPL measures how much you're spending to generate each new prospective family. Calculate it by dividing your campaign cost by the number of open enrollment opportunities.
For example: If you spent $500 and got 50 tour requests, your CPL is $10 per lead.