
Discover exactly where your website visitors are located—down to the state and city—so you can focus your marketing efforts where they matter most.
What is Geographic Analytics?
Geographic Analytics is an interactive heat map that shows you where your enrollment site traffic is coming from, all the way from country level down to specific cities. You can drill down to identify which areas show the most interest in your childcare center, compare performance across different local markets, and adjust your marketing strategy in real time.
Both the map and ranked list update instantly when you change the view—no need to refresh the page. This makes it perfect for meetings or presentations where you need insights to appear immediately.
Why Geographic Analytics Matters for Your Childcare Center
Turn location data into actionable insights that grow your enrollment:
- Hyper-Local Targeting: Identify your top-performing cities and run geo-focused ads in those areas.
- Smarter Budget Allocation: Shift your marketing budget toward states and cities generating the most engaged visits.
- Campaign Comparison: Measure regional impact after launching location-based promotions or open house events.
- Faster Decisions: Live refresh keeps your maps and ranked lists updated without reloading the page.
- Unified View: All visitor counts, maps, and rankings live in one dashboard for easy reporting.
Understanding the Geographic View
Geographic Dropdown
Switch between Country, State, and City views with a single selector. The heat map and ranked list update instantly, keeping your workflow focused on insights rather than navigation.
Total Visitors and Ranked Lists
Each drill-down level includes a side panel that automatically ranks your top regions by visit count. The list updates in real time as you change levels, making it easy to spot your highest-traffic areas at a glance.
A running total of all visits for the selected level stays visible above the map. As you move from state to city, the total refreshes automatically so you always know the full audience size you're analyzing.
Dynamic Heat Map
Colors on the map deepen as traffic increases, giving you a quick visual cue of hotspots without digging through spreadsheets. Hover your cursor over any region to reveal precise visitor numbers for that state or city. Tooltips appear immediately, saving you from scrolling through the side list when you need a quick figure.
How to Access Geographic Analytics
Geographic Analytics works automatically for any client account within the Sites Analytics page. Follow these steps to explore your data:
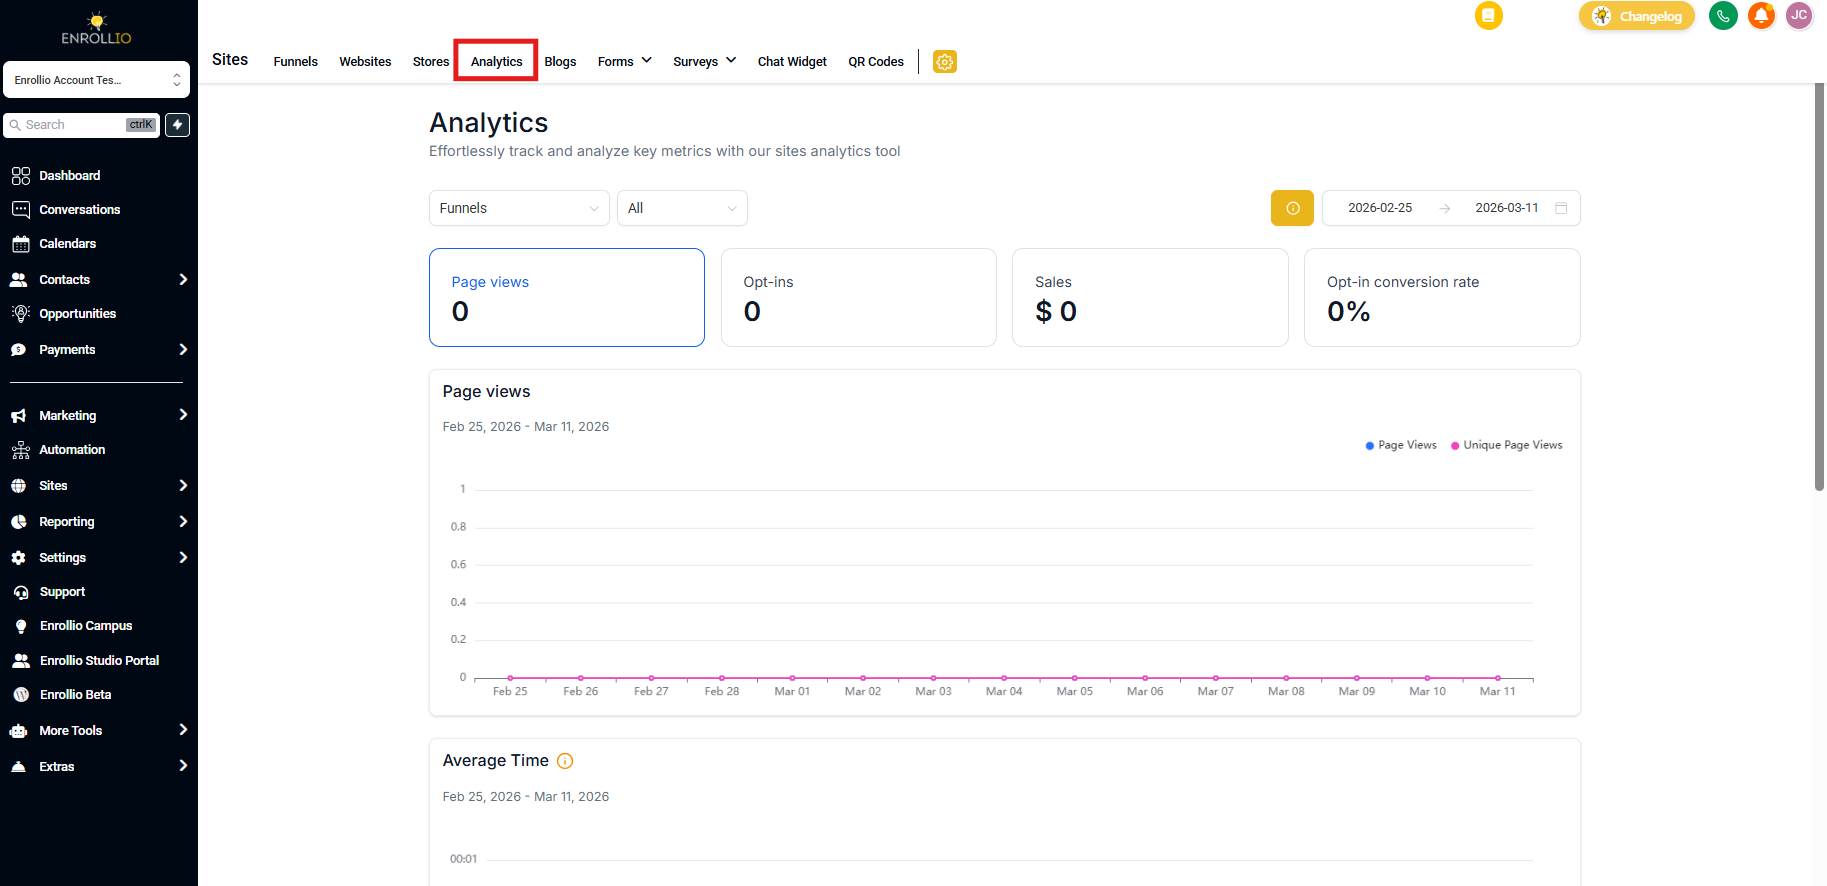
Step 1: Navigate to Analytics
- From your client account dashboard, click Sites in the left navigation bar
- Select the Analytics tab from the top menu
Step 2: View the Geographic Analytics Card
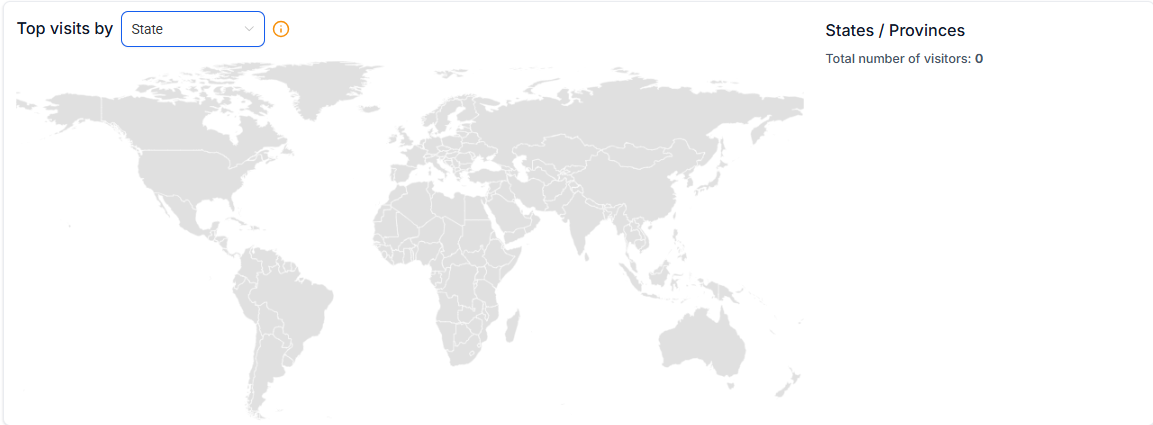
Scroll down to the Geographic Analytics card (located beneath Page Views). From here you can:
- Use the drill-down dropdown (Country / State / City) above the map to choose your level
- Hover over any shaded region to see its visitor count
- Review the ranked list on the right to compare top locations
Step 3: Apply Your Insights
Use what you learn to maximize your regional results. For example:
- Shift ad spend to high-performing cities
- Create localized landing pages for top regions
- Plan open house events in areas showing strong interest
- Adjust your messaging to speak to specific communities
Frequently Asked Questions
Do I need to add any extra tracking scripts to see state and city data?
No. If Sites Analytics is already capturing page views, Geographic Analytics will automatically populate with location data.
Is the heat map data available in real time?
Visitor counts update as new sessions are recorded, so the map refreshes automatically without a full page reload.
Does this include both enrollment pages and enrollment sites?
Yes. The view follows your Analytics context (enrollment pages, enrollment sites, or both) and date range, so results reflect the scope you select on the Analytics page.
Can I export this geographic data?
The geographic view is designed for visual analysis within your dashboard. For detailed reporting, use the overall Analytics export features available on the main Analytics page.