
Visitor Data Widgets
Track how families interact with your enrollment pages and websites using visitor data widgets on your dashboard. These widgets help you understand which pages attract the most interest and when families are most active.
Available Visitor Data Widgets
Total Enrollment Page Views
Tracks all views across your enrollment pages. You can customize this widget to show specific pages or page types.
Unique Enrollment Page Views
Counts unique visitors across your enrollment pages. This shows how many different families viewed your pages, not just total clicks.
Total Enrollment Site Views
Tracks total views for all your enrollment sites combined. Use this to see overall traffic trends.
Unique Enrollment Site Views
Shows unique visitors across all your enrollment sites. This helps you understand your reach to new families.
Enrollment Page Views Trend
A line chart showing enrollment page views over time. Perfect for identifying busy seasons or the impact of marketing campaigns.
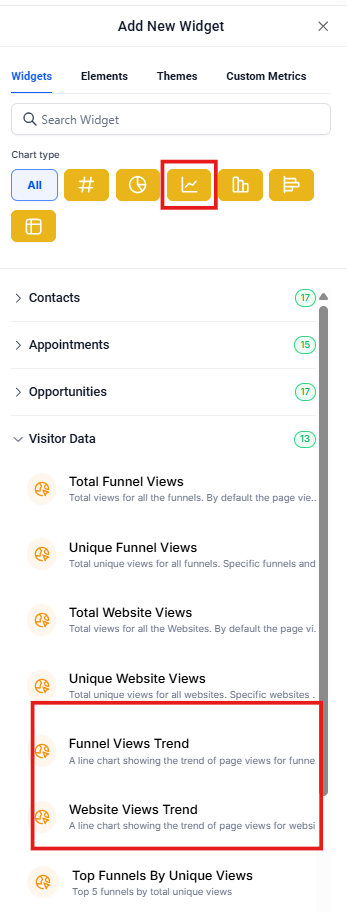
Enrollment Site Views Trend
A line chart displaying website view trends over your selected time period. Compare different weeks or months to spot patterns.
Top Enrollment Pages by Unique Views
Shows your top 5 enrollment pages based on unique visitor counts. Use this to see which programs or offerings generate the most interest.
Top Enrollment Sites by Unique Views
Displays your top 5 enrollment sites ranked by unique visitors. Helpful if you manage multiple locations or programs.
Total Enrollment Page Views (Last Week)
Quick snapshot of enrollment page views over the past seven days.
Unique Enrollment Page Views (Last Week)
Shows unique visitors to your enrollment pages in the past week.
Total Enrollment Page Views (Last Month)
Total enrollment page views for the last 30 days. Great for monthly reporting.
Unique Enrollment Page Views (Last Month)
Unique enrollment page visitors over the last month.
Total Opt-ins (All Enrollment Pages)
Tracks total form submissions and opt-ins across all your enrollment pages. This is your conversion metric—how many visitors became prospective families.
💡 Pro Tip
Compare your "Total Views" against "Total Opt-ins" to calculate your enrollment page conversion rate. If you're seeing lots of views but few opt-ins, it may be time to update your messaging or forms.
How to Add Visitor Data Widgets
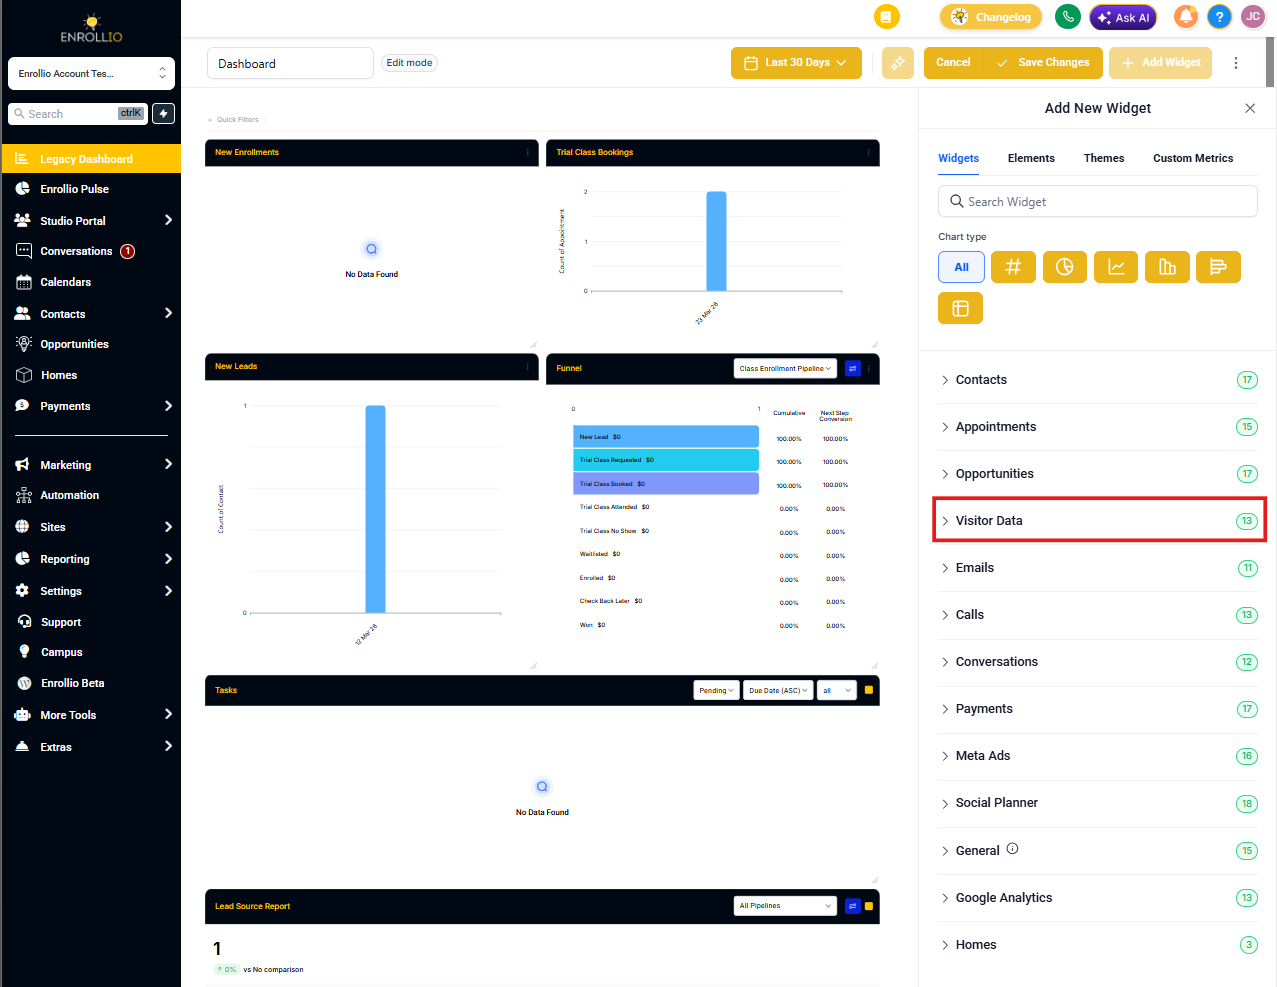
- Click Dashboard in your main navigation
- Click Add Widget in the top right
- Select Visitor Data from the widget categories
- Choose the specific widget you want to add
- Customize the date range or filters if available
- Click Save
Using Visitor Data to Grow Enrollments
These widgets aren't just numbers—they tell you what's working. Here's how to use them:
- Identify your best pages: Double down on what's attracting families
- Spot drop-offs: High views but low opt-ins? Your forms or messaging may need work
- Time your outreach: Use trends to see when families are most active
- Measure campaigns: Track the impact of your marketing efforts in real-time