
Dashboard Summary AI
Dashboard Summary AI brings instant, actionable insights to every Enrollio dashboard—helping you spot trends, identify risks, and make data-driven decisions without sifting through raw numbers. This article explains what it is, why it's useful, and exactly how to enable and use it.
What is Dashboard Summary AI?
Dashboard Summary AI is a built-in analysis tool that reviews your entire dashboard and generates a plain-language summary of key movements, growth patterns, and potential risks. It provides context-rich insights and supports follow-up questions, plus widget-level insights when you hover over any widget in your Enrollio reporting.
Key Benefits of Dashboard Summary AI
These benefits focus on how the feature saves time and improves clarity so you can act sooner on trustworthy data:
- Instant narrative: See the story behind your enrollment numbers in seconds—no manual analysis required.
- Proactive detection: Surface downward trends early so you can intervene before enrollment performance slips.
- Guided exploration: Ask follow-up questions from the summary to understand drivers and anomalies in your enrollment data.
- Focused diagnosis: Hover any widget for a concise AI insight to validate setup, trends, or comparisons.
- Streamlined interface: A refreshed header places key controls where you expect them for faster navigation.
Dashboard AI Summary
Running a dashboard-wide summary is ideal for daily standups and weekly reviews. It translates dozens of metrics into a clear briefing that respects your active date range and filters.
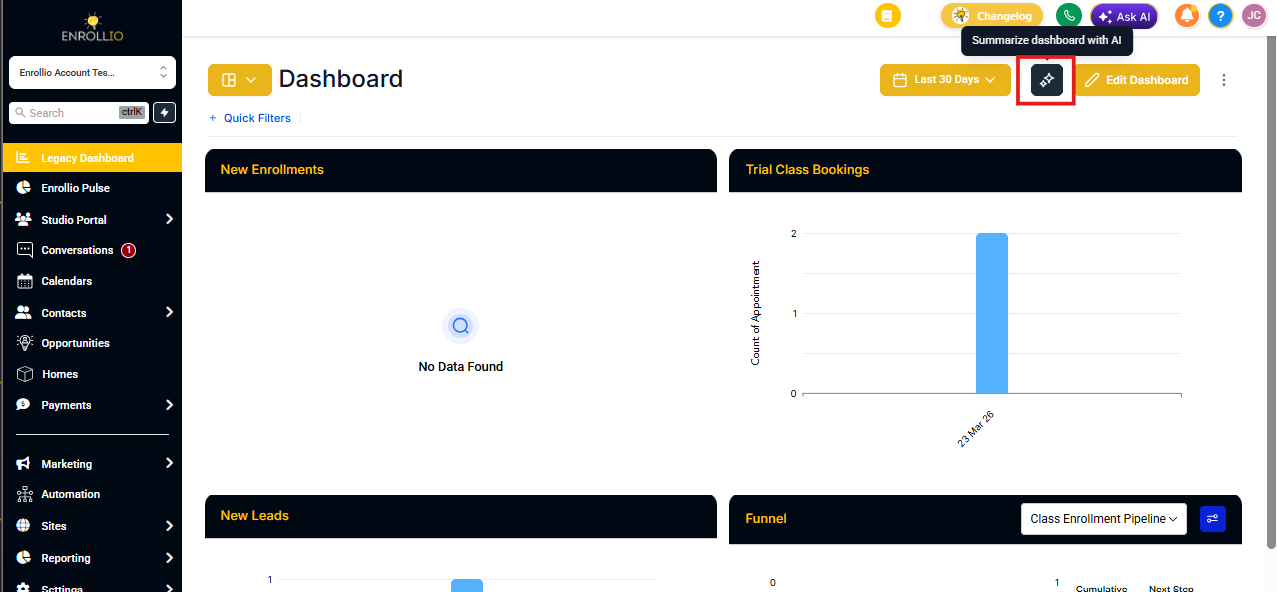
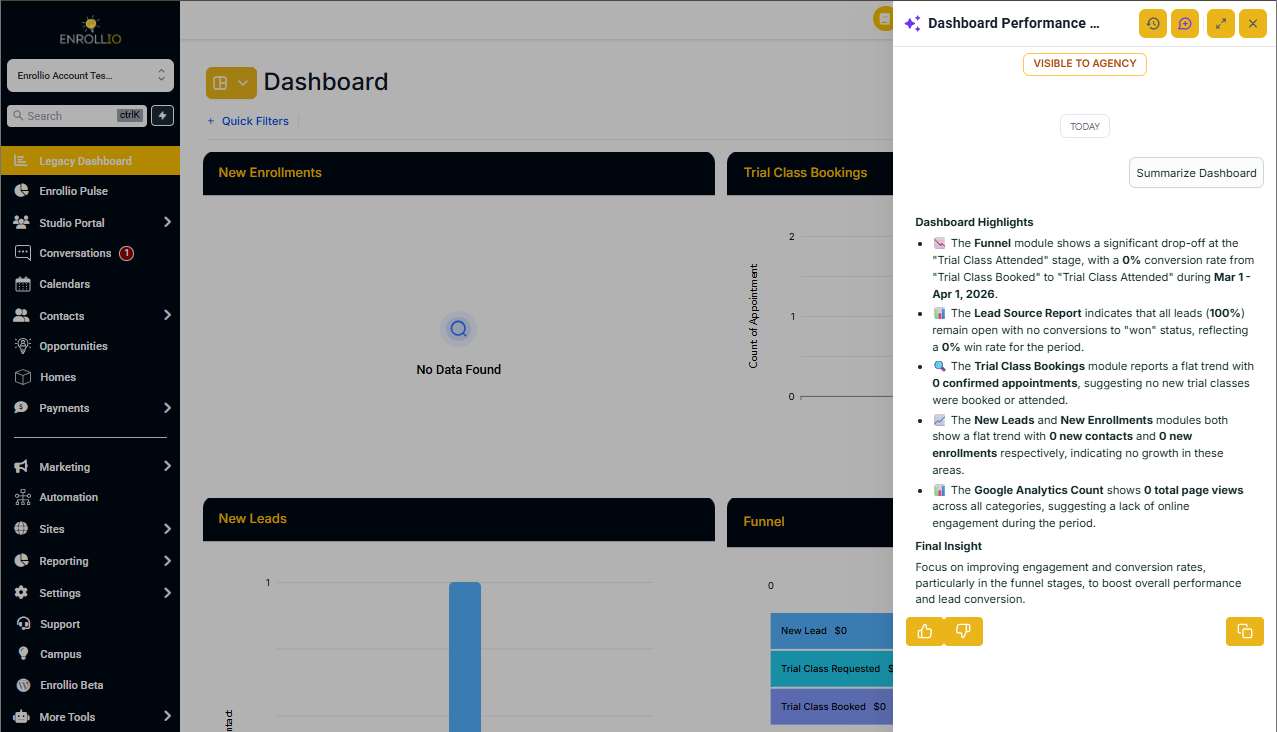
Click ✨ Summarize Dashboard with AI to generate a plain-English synopsis of your current dashboard. The summary highlights growth patterns and metrics that need attention, helping you prioritize next actions for your childcare center.
Generated AI Insights
Beyond "what changed," these insights suggest "why" it might have changed and where to look next. This turns summaries into actionable decisions.
Expect context such as peaks, dips, and potential causes—like seasonal enrollment patterns or tour-to-enrollment conversion changes—plus recommended next steps you can validate with your team. Use insights to guide deeper analysis by opening the relevant dashboard or widget configuration as needed.
Widget-Level AI Summaries
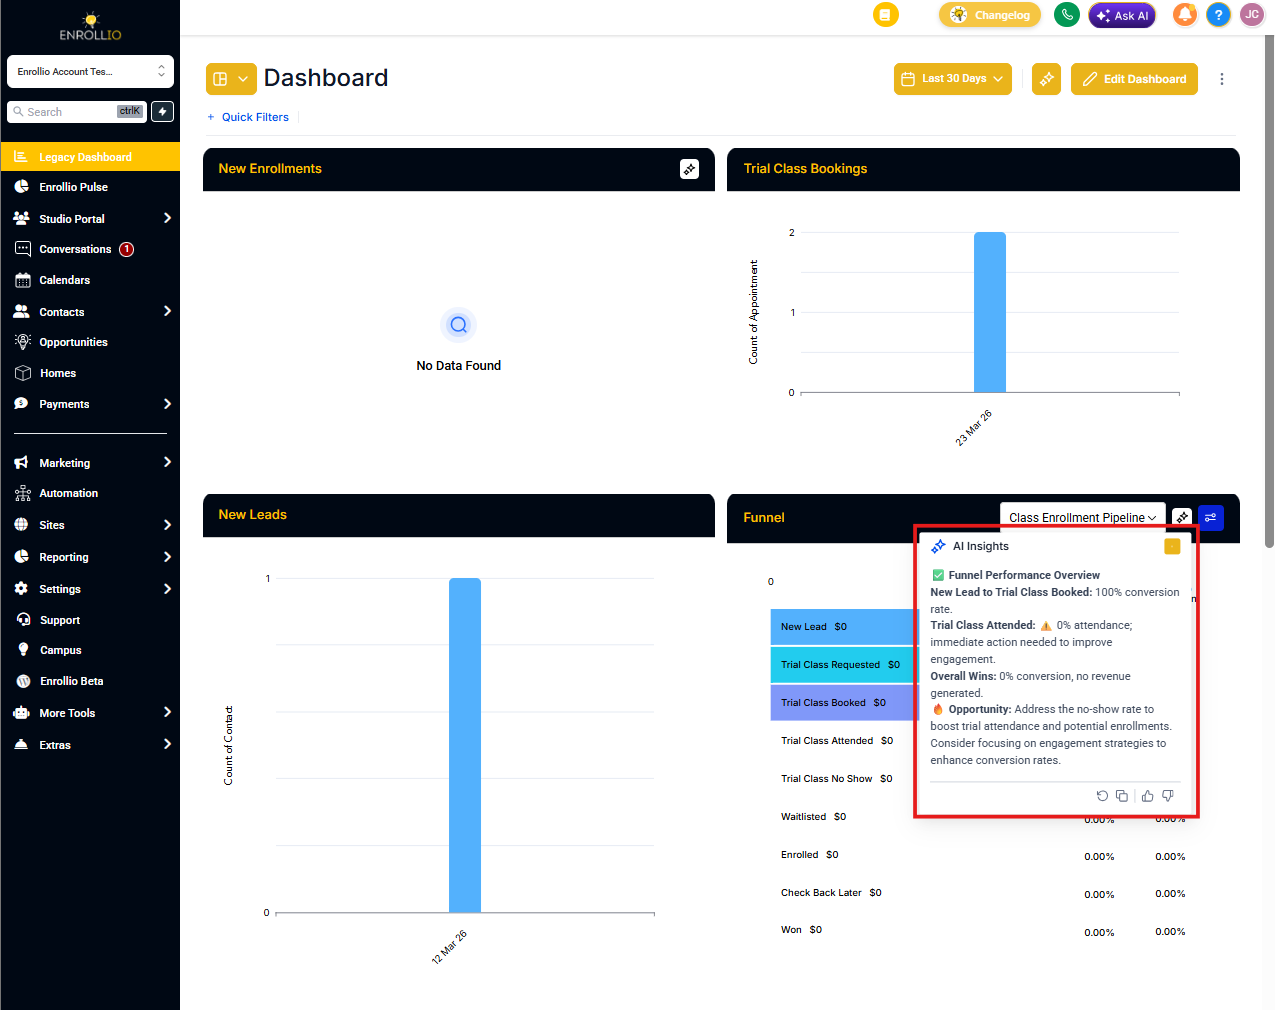
When a single metric looks off—like a sudden drop in tour bookings or waitlist additions—hover the widget and request an AI insight card to quickly validate setup, trends, and comparisons.
Hover over any chart, table, or KPI widget and select the AI icon to generate a widget-level insight. Use widget insights to pinpoint outliers without opening multiple reports.
How to Set Up Dashboard Summary AI
Follow these steps to get started quickly:
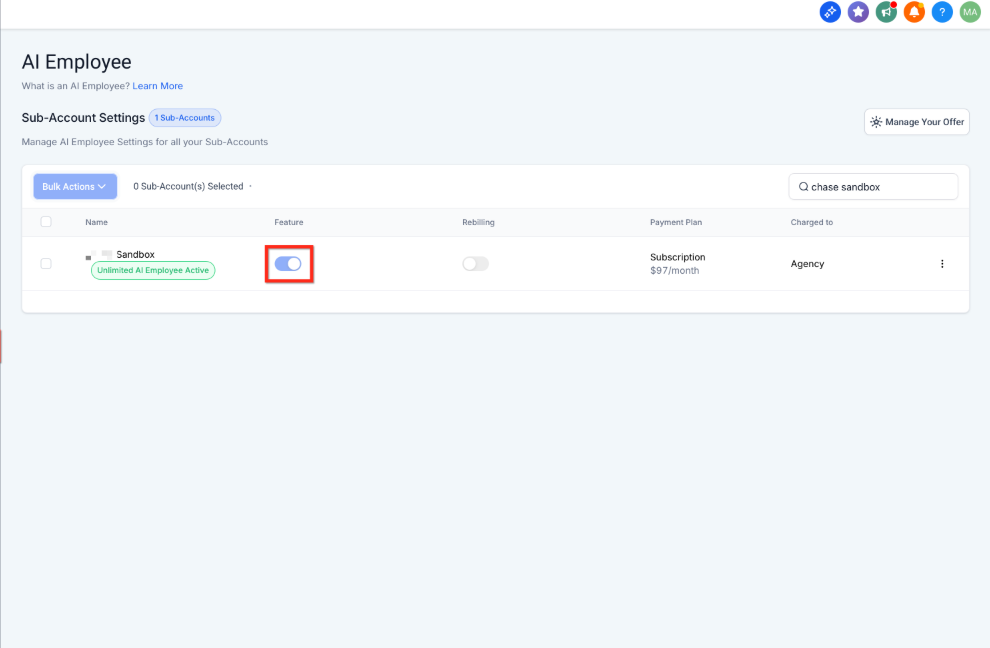
1. Enable AI Employee (Enrollio View)
- Go to Enrollio → Settings → Company
- Toggle AI Employee ON for your Client Account
- See AI Employee Overview for additional details
2. Open Any Dashboard and Summarize
- In your Client Account, navigate to the target dashboard
- Click ✨ Summarize Dashboard with AI in the header
- Review the summary callouts for wins, risks, and suggested next steps
3. Ask Follow-Up Questions (Custom Widgets Only)
Use the follow-up field to ask natural-language questions like "What are the key driving trends?" or "Why did tour bookings drop last week?"
Note: Follow-ups only work on custom widgets, not standard widgets.
4. Get Widget-Level Insights
- Hover over any widget
- Click the AI icon
- Read the widget insight card
If you need to build or adjust widgets, see How to Create & Add Dashboard Widgets.
Frequently Asked Questions
I don't see the ✨ Summarize Dashboard with AI button—what should I check?
Confirm AI Employee is enabled at Enrollio → Settings → Company.
Do summaries honor my date range and filters?
Yes. Run Summarize after changing filters or dates so the narrative reflects your current view. This is especially useful when comparing enrollment seasons or analyzing specific program types.
Why do follow-ups only work on custom widgets?
Follow-ups draw context from your custom widget configuration. Build or edit the needed custom widgets, then ask your question again.
How is AI usage billed?
AI features are billed per current AI Employee pricing. For the latest details, see AI Employee Overview.
Related Articles
- AI Employee Overview
- How To Create A Custom Dashboard
- How to Create & Add Dashboard Widgets
- How To Manage Dashboard Permissions