
What is Custom Metrics?
Custom Metrics let you track the KPIs that matter most to your childcare business—right inside your dashboards and reports. Instead of exporting data to spreadsheets, you can combine enrollment numbers, tour conversions, and other data points to calculate metrics like enrollment rate, cost per lead, or ROI from marketing campaigns.
You decide how each metric should display (percentage, currency, whole numbers, etc.) and add it as a widget to any dashboard or report. Custom Metrics also work across client accounts, so you can push them to new locations when needed.
Note: This feature is available on plans $497 and above.
Key Benefits of Custom Metrics
Custom Metrics bring flexibility and precision to your reporting by letting you design KPIs that truly reflect your childcare business goals. Here's what makes them powerful:
- Personalized KPIs: Combine data from multiple sources to create metrics tailored to your center—like tour-to-enrollment rate, average family lifetime value, or waitlist conversion rate.
- Efficient Setup: Build new metrics from scratch or clone existing ones to save time and maintain consistency across reports.
- Smart Formula Editor: Insert metrics from different data sources, add operators and constants, and use live validation to ensure error-free calculations.
- Flexible Display Options: Choose how values appear—Integer, Float, Currency, or Percentage—for clear presentation that makes sense for childcare metrics.
- Trend Direction Controls: Define whether an increase or decrease should be considered positive, aligning data with your business logic.
- Customizable Charts: Rename charts, apply themes, and compare results across different time periods for deeper insights into enrollment trends.
- Seamless Integration: Use custom metrics across Dashboards, Custom Reports, and Client Accounts, ensuring your KPIs are always accessible where you need them.
How to Set Up Custom Metrics
Step 1: Open Dashboard
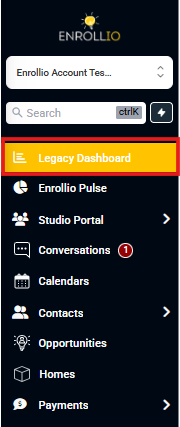
From the left-hand menu, click on Dashboard to access your reporting view. This is where you'll manage widgets and set up new custom metrics for tracking key performance indicators.
Step 2: Enter Edit Mode
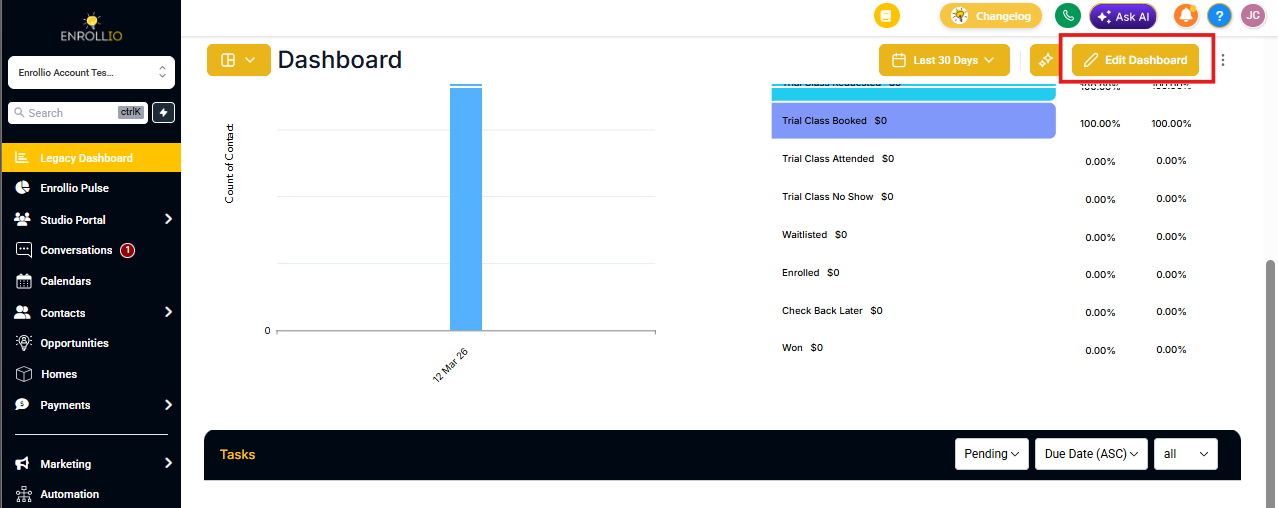
Click the Edit Dashboard icon at the top right of your dashboard. This enables edit mode, allowing you to add or configure widgets, including custom metrics.
Step 3: Add Widget
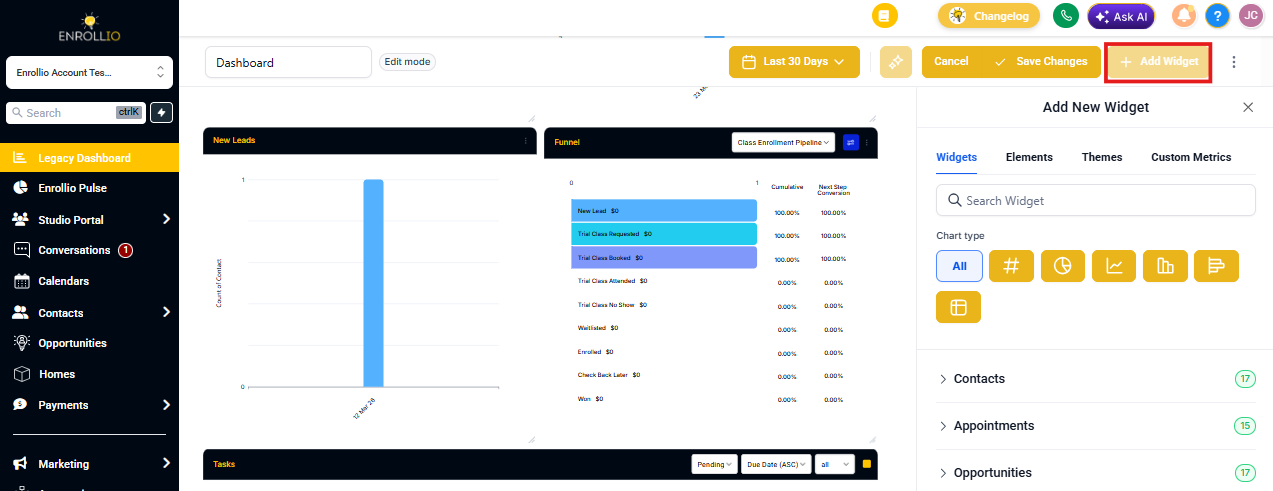
In edit mode, click the Add Widget button at the top right. This opens options for inserting different types of widgets into your dashboard, including custom metrics.
Step 4: Select Custom Metrics
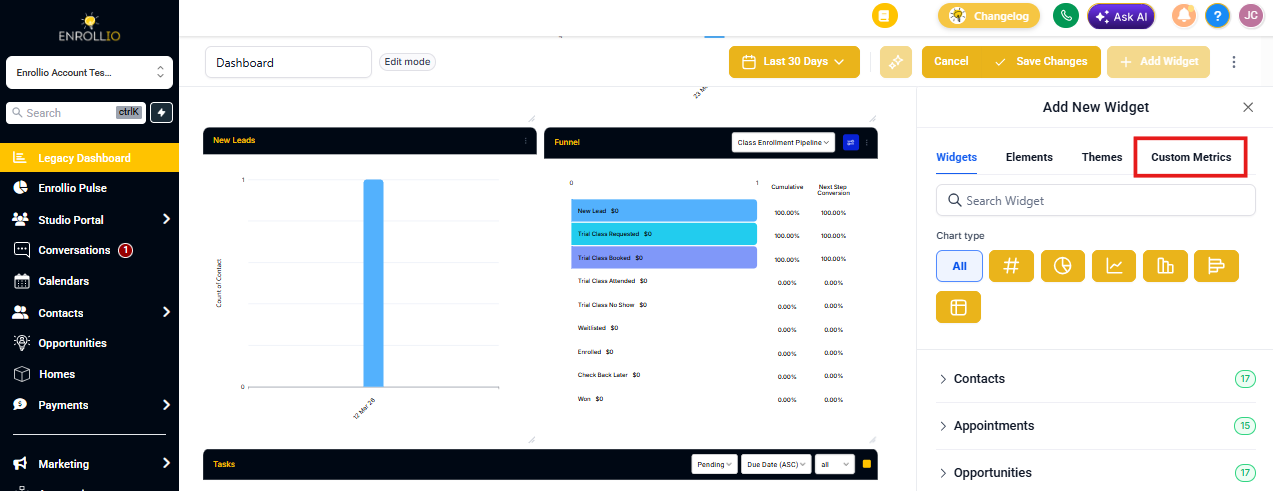
From the widget options panel, click on the Custom Metrics tab. This displays the tools you need to create personalized KPIs for your dashboard.
Step 5: Create Custom Metric
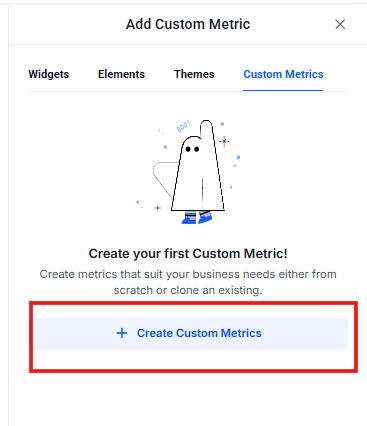
Click the + Create Custom Metrics button to begin building your metric. This opens the setup flow where you can define and customize your KPI.
Step 6: Choose Starting Point
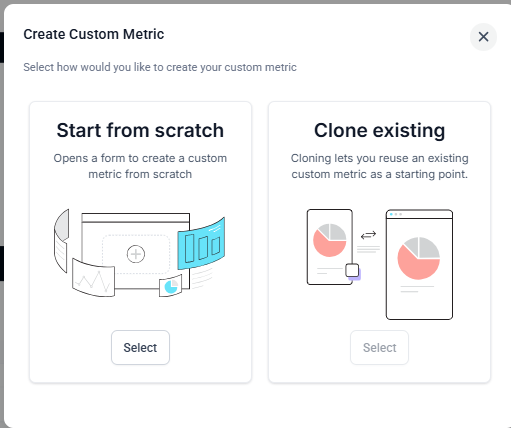
Select whether to Start from scratch to build a new metric or Clone existing to reuse a previously created one. This choice helps you either create fresh KPIs or save time by adapting an existing setup.
After choosing, click the Select button at the bottom to confirm and open the setup form.
Step 7: Enter Metric Details
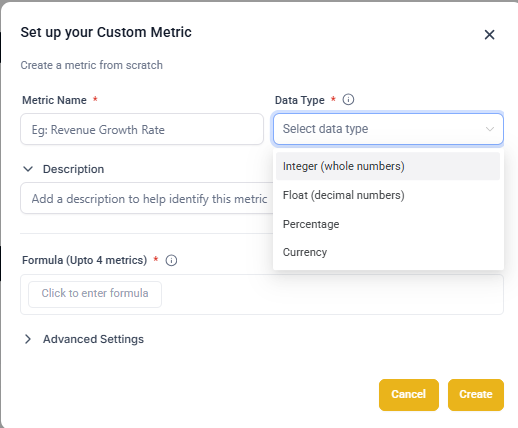
Complete the following fields to define your custom metric:
- Metric Name: Provide a clear name like "Tour-to-Enrollment Rate" or "Waitlist Conversion" so the metric is easy to identify.
-
Data Type: Choose how the value should display:
- Integer – whole numbers (e.g., number of enrolled families)
- Float – decimals (e.g., 3.45 average tours per week)
- Percentage – rates and conversions (e.g., 68% enrollment rate)
- Currency – dollar amounts (e.g., $2,450 average enrollment value)
- Description: Add a short explanation to clarify the purpose of this metric for you and your team.
Step 8: Add Formula
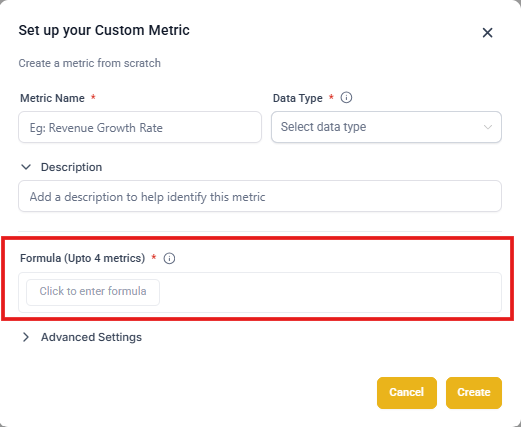
The Formula field is where you define how your custom metric will be calculated. You can combine up to four different metrics, apply mathematical operators (+, -, ×, ÷), and add constants to shape the calculation.
This flexibility lets you create KPIs that reflect your childcare business needs, rather than being limited to standard metrics.
Example: Calculate Tour-to-Enrollment Rate by dividing the number of Won Enrollment Opportunities by the number of Tours Booked, then multiply by 100 to display as a percentage.
💡 Pro Tip: Common childcare formulas include:
• Enrollment Rate = (Enrolled Families ÷ Total Tours) × 100
• Cost Per Enrollment = Marketing Spend ÷ New Enrollments
• Waitlist Conversion = (Enrolled from Waitlist ÷ Total Waitlist) × 100
Step 9: Configure Advanced Settings
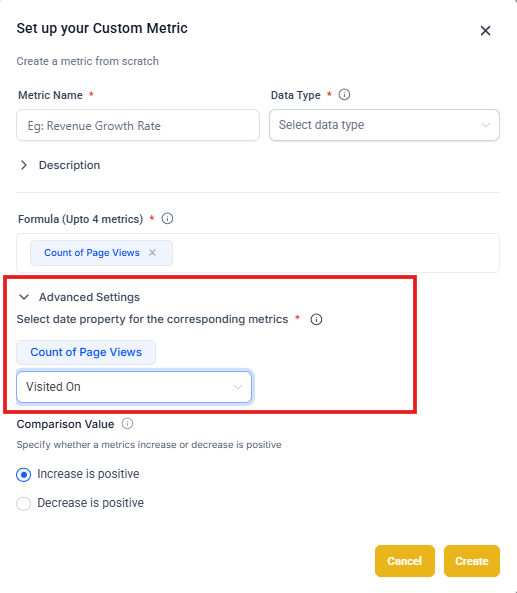
In the Advanced Settings section, specify the date property that applies to each metric used in your formula. This ensures your custom metric is calculated consistently and tied to the correct time dimension.
For example, if your formula includes Page Views and Tours Scheduled, each metric may have its own associated date property:
- Page Views → Visited On (the date the enrollment page was viewed)
- Tours Scheduled → Created On (the date the tour was booked)
The dropdown options shown will change dynamically based on the metrics you selected in the formula step. Each metric displays only the relevant date fields that apply to it.
By choosing the right date property for each metric, you ensure that calculations like conversion rates or enrollment percentages are aligned with the correct time events. For instance, matching Page Views (Visited On) with Tours Scheduled (Created On) lets you measure how many visits actually turned into booked tours within the same timeframe.
Step 10: Set Comparison Value
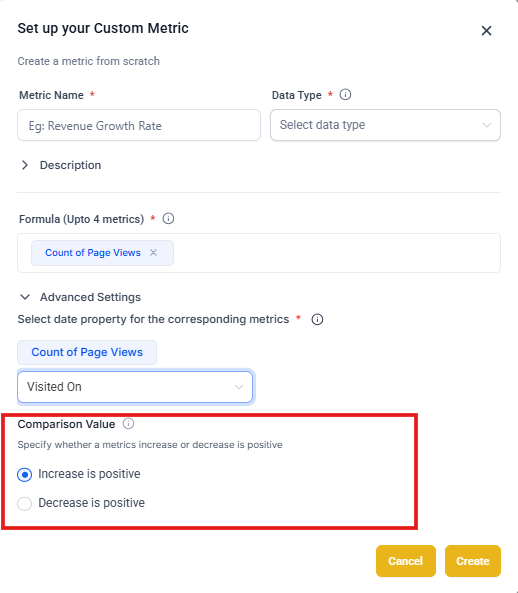
In the Comparison Value section, define whether an increase or decrease in your custom metric should be considered positive.
- Increase is positive – Select this if a higher value reflects business growth or success (e.g., enrollment rate, number of tours, new families).
- Decrease is positive – Select this if a lower value signals improvement (e.g., time to respond to inquiries, parent complaints, waitlist cancellations).
This setting ensures your dashboards and reports highlight changes in a way that aligns with your business goals. By marking the trend correctly, your team will interpret performance shifts in the right context.
Step 11: Finalize Metric
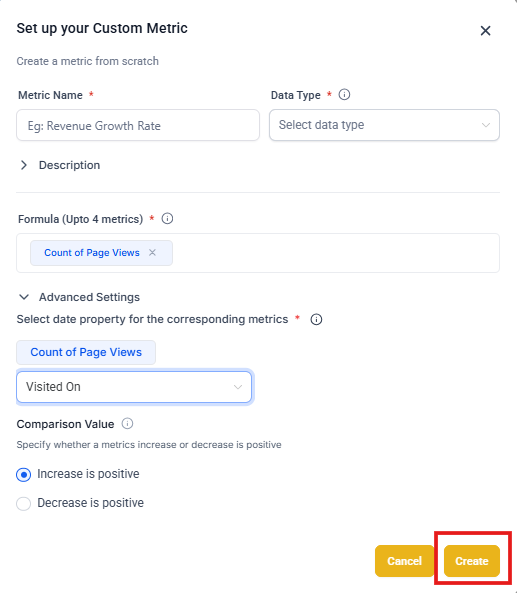
Once all details, formulas, and settings are complete, click Create to save your custom metric. Your new metric will now be available to add as a widget on your dashboard or custom report, displaying results based on your defined logic.
Frequently Asked Questions
Can I combine metrics from different sources that use different date properties?
Yes. When building your formula, each metric will present its own relevant date options in the dropdown. You'll need to select the correct property for each.
For example, when calculating tour-to-enrollment conversion, you might use:
- Tours Scheduled → Created Date
- Enrollment Opportunities → Closed Date
This ensures the formula calculates consistently. Just make sure to align your selections with the business outcome you want to measure—otherwise the results may not reflect the intended KPI.
How do trend direction settings impact reporting accuracy?
Trend direction defines whether an increase in the metric is considered positive or negative. This affects how your dashboards and reports highlight changes.
For example, if you set "Increase is positive" for Total Enrollments, growth will display as a positive trend. However, if you're tracking Response Time to Parent Inquiries, you'd want to set "Decrease is positive" because faster response times indicate better performance.
Setting the correct trend direction ensures your team immediately understands whether metric changes are favorable without needing additional context.
Can I use Custom Metrics across multiple locations?
Yes. Custom Metrics work across client accounts, so if you manage multiple childcare locations, you can create a metric once and push it to other accounts. This ensures consistency in how you track performance across all your centers.
What happens if I change the formula of an existing Custom Metric?
When you edit the formula of an existing Custom Metric, all dashboards and reports using that metric will automatically update to reflect the new calculation. This means you don't need to recreate widgets—the changes apply everywhere the metric is used.
Just be aware that historical data will also be recalculated based on the new formula, which may change past trend lines in your reports.