
Table charts let you view detailed enrollment data in an organized, easy-to-scan format. Perfect for tracking enrollment opportunities, tour schedules, or parent contact information at a glance.
Step 1: Add a Widget to Your Dashboard
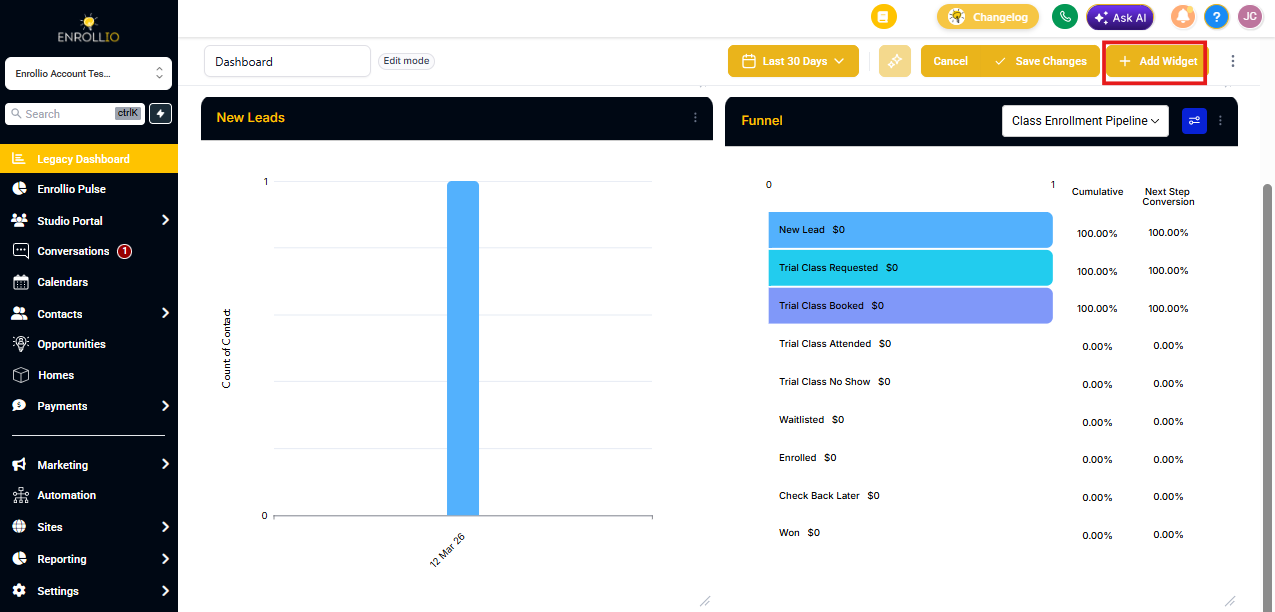
Navigate to your dashboard and click the Edit icon in the top right corner. Then click Add Widget.
Step 2: Select Table as Your Chart Type
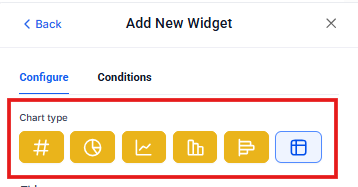
Scroll through the available widget options and find the data you want to display (like enrollment opportunities or tour bookings). Click on the widget, then change the Chart Type dropdown to Table.
Step 3: Configure Your Table Columns
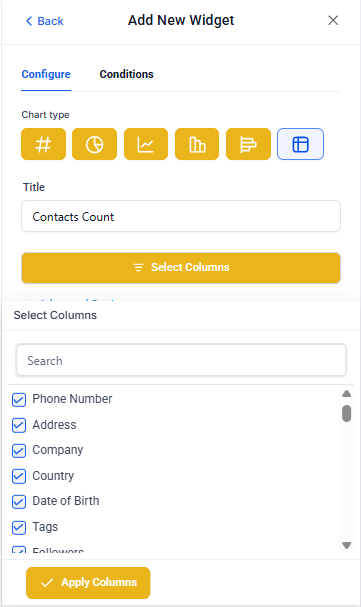
Click Select Columns to choose which information appears in your table. For example, you might want to show parent name, child age, tour date, and enrollment status.
In Advanced Settings, you can choose which column to sort by default — like sorting enrollment opportunities by date created or tour bookings by scheduled time.
Step 4: Save Your Widget
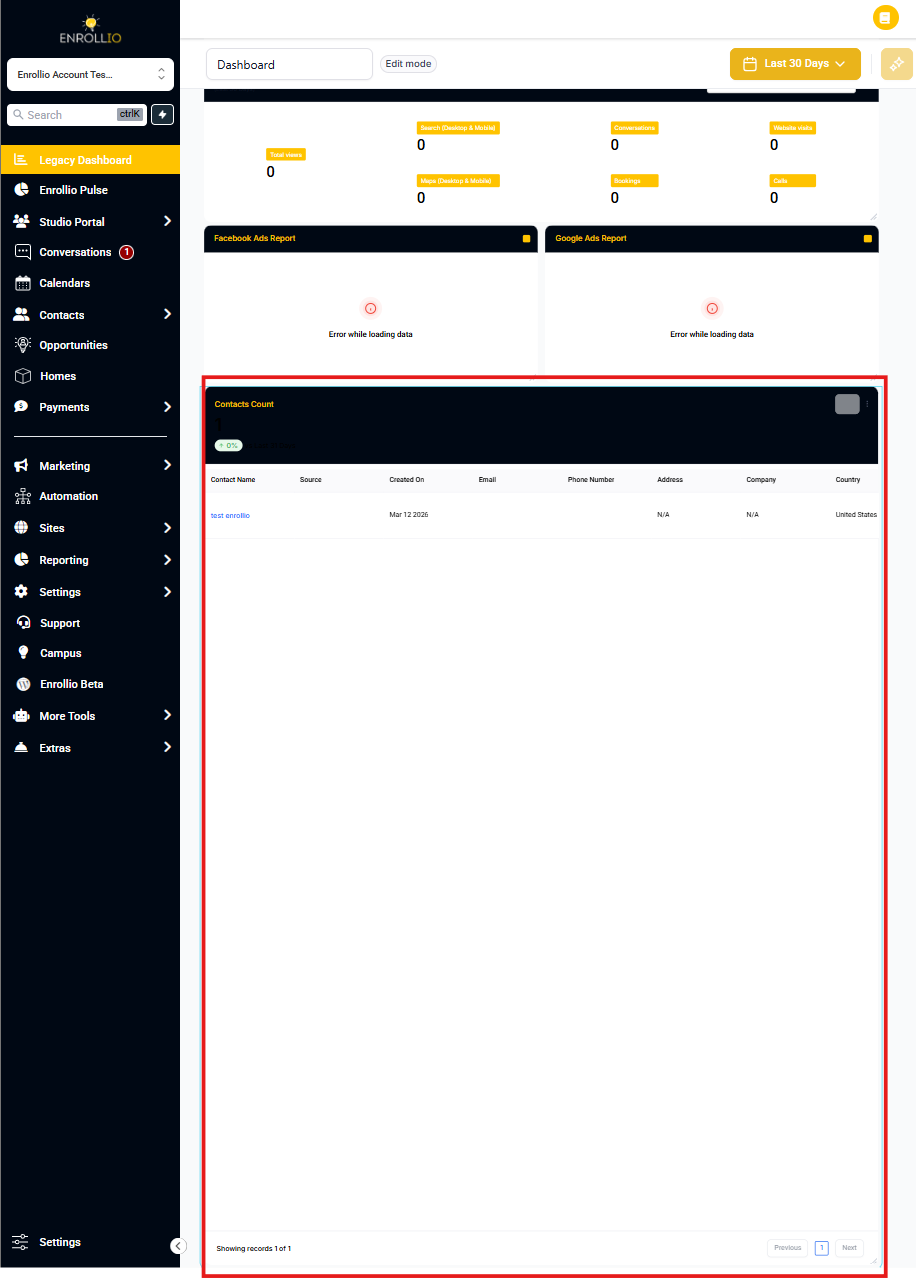
Click Save to add your table widget to the dashboard. You can resize or reposition it by dragging the edges or moving it to your preferred location.
Common Uses for Table Widgets
- Upcoming Tours: See who's scheduled to visit, with contact info and notes
- Active Enrollments: Track families in your enrollment pipeline by status
- Waitlist Management: Monitor waitlisted families by age group and wait time
- Staff Assignments: View which staff members are assigned to which classrooms