
What is Traffic Source Analytics?
Traffic Source Analytics shows you exactly where families find your enrollment pages and sites. See at a glance whether visitors are coming from Facebook ads, Google searches, direct links, or referrals from other sites.
The visual dashboard breaks down daily traffic by channel so you can measure which marketing efforts are actually bringing families to your door.
Why Traffic Source Analytics Matters
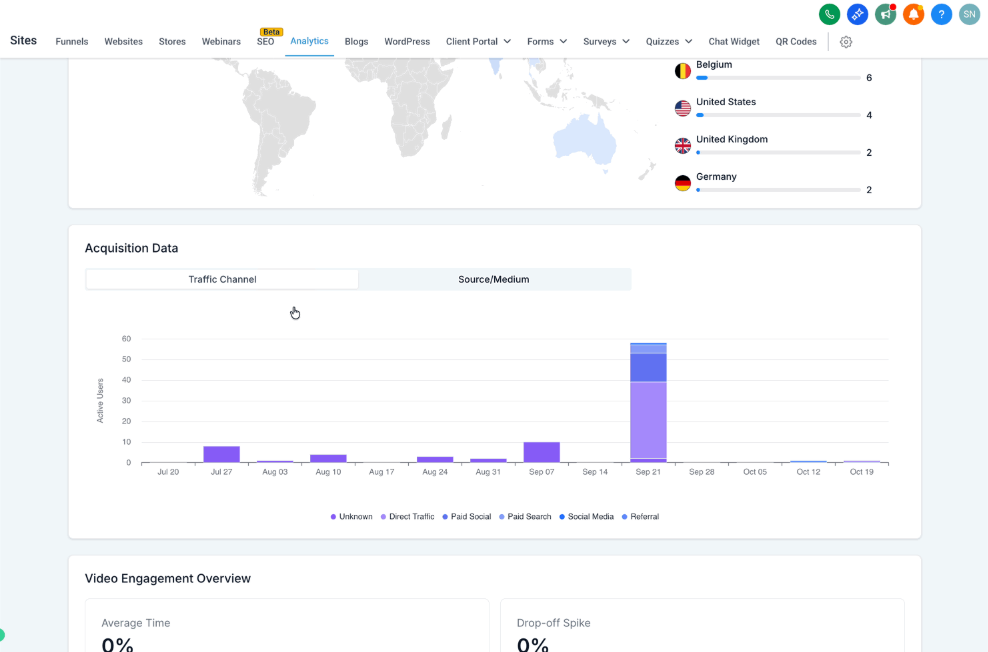
Channel clarity: Quickly see how much traffic comes from Paid Search, Paid Social, Organic Search, Direct visits, Referrals, and organic Social.
Faster decisions: Spot trends, growth, or sudden drops in traffic with daily stacked bars and instant tooltips.
Better attribution: Make sure your paid ad clicks get counted correctly instead of showing up as Direct or Unknown traffic.
Team alignment: Share clear, color-coded reports with your staff or marketing partners so everyone sees the same picture.
Focused analysis: Click any single day to filter the entire dashboard and investigate what happened on that date.
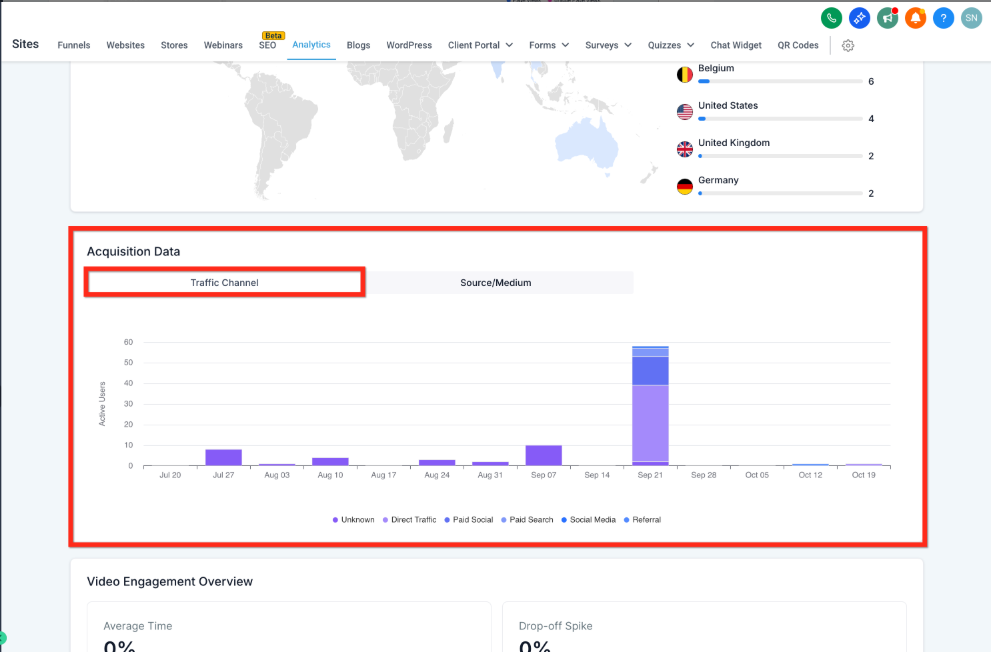
How Enrollio Determines Traffic Channels
Enrollio automatically categorizes your traffic based on several signals:
UTM parameters: When you add utm_source, utm_medium, and utm_campaign to your links, Enrollio reads them to classify the visit.
Click IDs & auto-tagging: Parameters like gclid (Google), msclkid (Microsoft), or fbclid (Facebook) confirm paid traffic.
Referrer detection: Known search engines and social networks are matched automatically. No referrer or UTMs means the visit is classified as Direct.
Other (Unknown/Unmapped): Sessions without usable tracking data or with incomplete parameters end up here.
How to View Your Traffic Sources
Follow these steps to see where your enrollment traffic is coming from:
- Go to Sites → Analytics
- Select Enrollment Pages/Sites then choose your Date Range
- Scroll to Acquisition Data
- Select the Traffic Channel tab for a high-level view (Direct Traffic, Paid Social, Paid Search, Social Media, Referral)
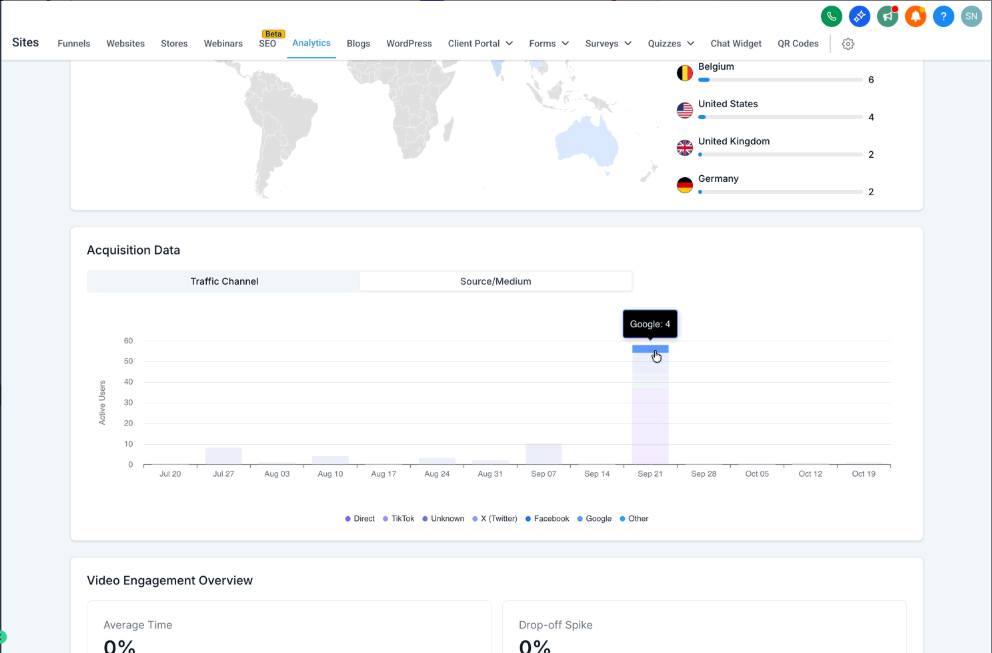
- Switch to the Source/Medium tab to see specific origins like google, facebook, direct, or TikTok
- Hover over any bar to see the exact visit count for that channel on that date
Common Questions
Which metric is shown in the chart?
The chart displays daily visits to your enrollment pages and sites within your selected date range.
Why is some traffic showing as Other (Unknown/Unmapped)?
Sessions may lack UTM parameters, have broken tracking codes, or arrive without referrer information (common with some mobile apps and redirects). To reduce Unknown traffic, add consistent UTM codes to all your marketing links and check that redirects preserve tracking parameters.
What timezone does the dashboard use?
Data aggregates based on your account timezone setting. If your team is in different time zones, communicate which timezone the reports use to avoid confusion about daily numbers.
How far back can I view traffic data?
You can select any date range using the date picker. Historical data depends on when you started using Enrollio's analytics features.