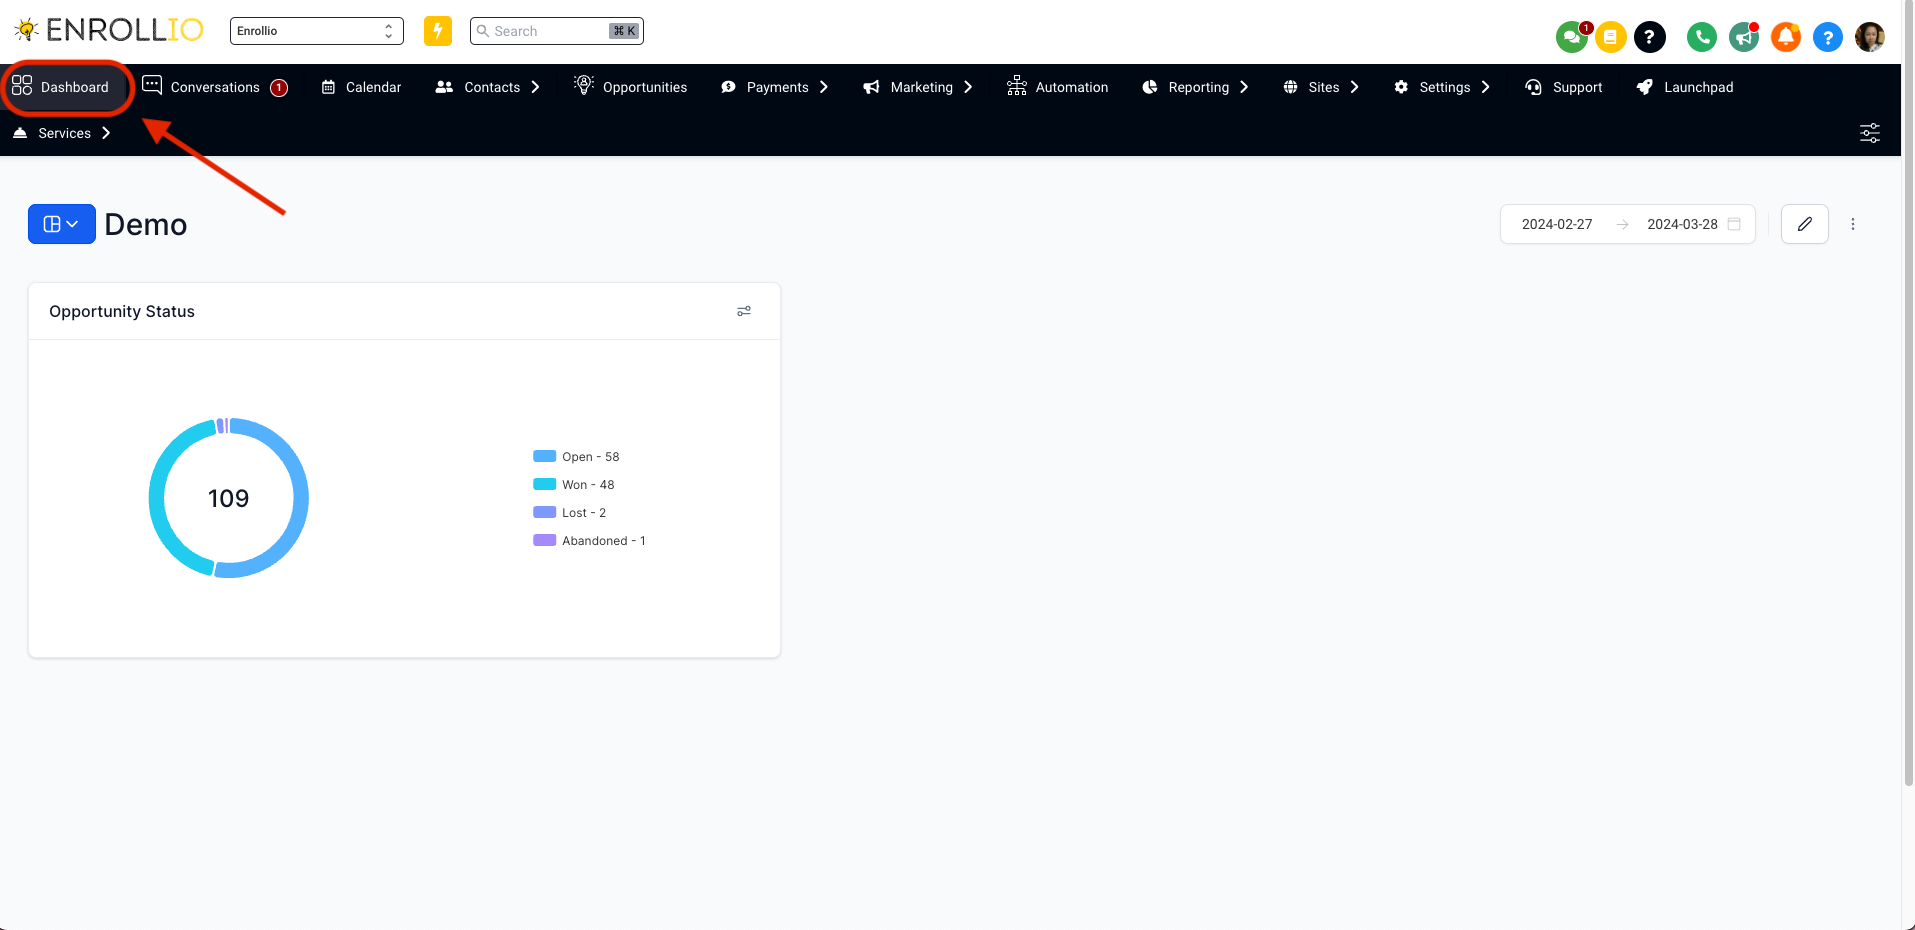
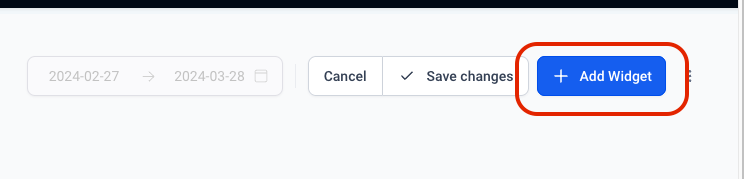
Go to your dashboard. Click on the edit icon and then Add widget.
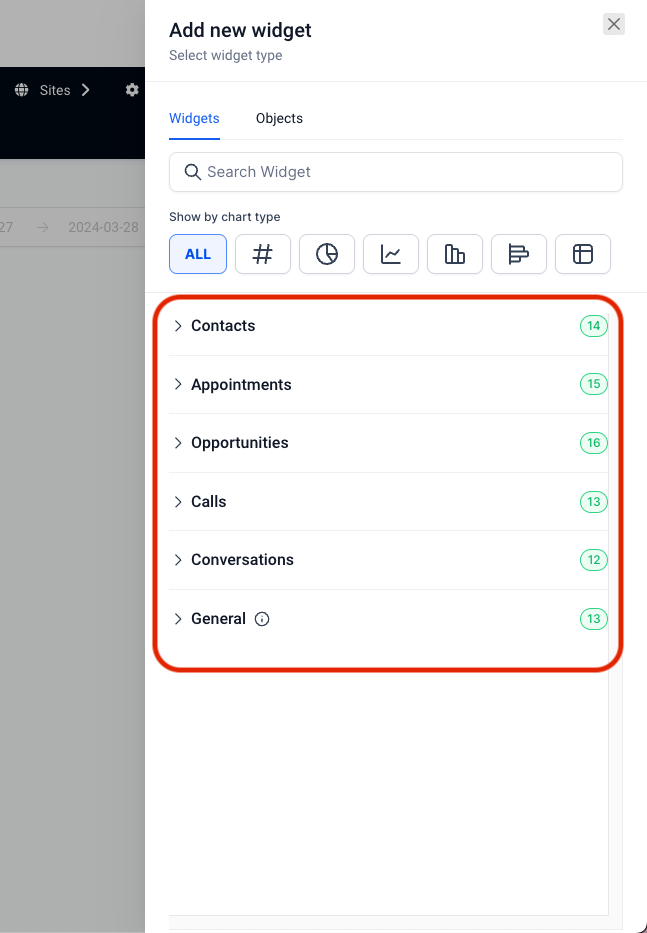
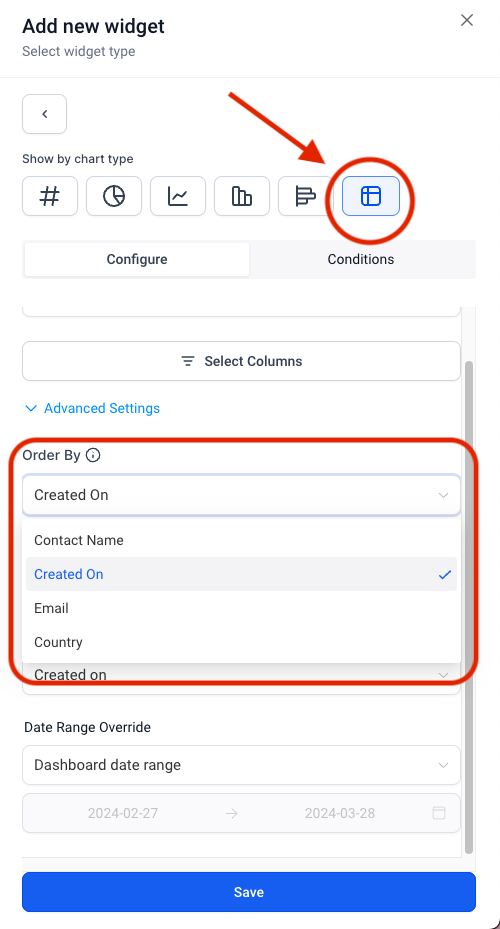
Select the widget that you want to add and then change the chart type to Table
You have the option to Select Columns to manage columns you want on your widget. Please note that the columns depend on the type of widget.
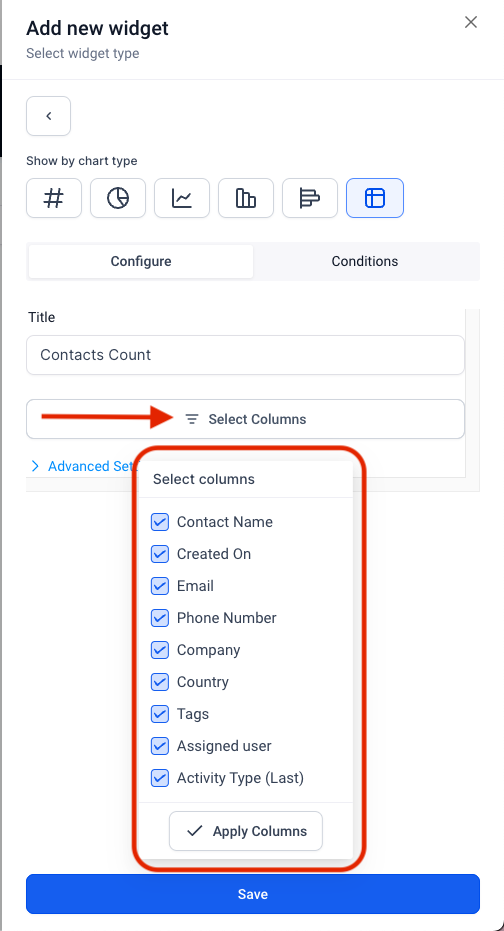
In advance settings, you have the option to choose the column on which you want to order the table.
Click the save button.

Under Conditions, you can further filter the data that will be shown on your table.